Footwear outsole images were obtained from 150 pairs of used shoes. The motivation for constructing the database was to enable a statistical analysis of two-dimensional (2D) images of shoe outsoles, to understand within shoe (between replicate images of the same shoe) and between shoe variability, and to develop methods for the evaluation of forensic pattern evidence of shoeprints. Since we scanned the outsole of the used shoes, the images capture not only the outsole pattern design but also the marks that arise from wear and tear and that may help identify the shoe that made the impression. Each shoe in a pair was scanned five times, so that replicate images can be used to estimate within-shoe variability. In total, there are 1500 2D images in the database. The EverOS footwear scanner was used to capture the outsole of each shoe. The scanner detects the weight distribution of the person wearing the shoe when he or she steps on the scanning surface. It images the portions of the outsole that make contact with the scanning surface. The database is a useful resource for forensic scientists or for anybody else with an interest in image comparison. The database we describe, was constructed by researchers in the Center for Statistics and Applications in Forensic Evidence (CSAFE) at Iowa State University.
Statistical Methods for the Forensic Analysis of Geolocated Event Data
A common question in forensic analysis is whether two observed data sets originated from the same source or from different sources. Statistical approaches to addressing this question have been widely adopted within the forensics community, particularly for DNA evidence. Here we investigate the application of statistical approaches to same-source forensic questions for spatial event data, such as determining the likelihood that two sets of observed GPS locations were generated by the same individual. We develop two approaches to quantify the strength of evidence in this setting. The first is a likelihood ratio approach based on modeling the spatial event data directly. The second approach is to instead measure the similarity of the two observed data sets via a score function and then assess the strength of the observed score resulting in the score-based likelihood ratio. A comparative evaluation using geolocated Twitter event data from two large metropolitan areas shows the potential efficacy of such techniques.
Statistical methods for the forensic analysis of geolocated event data
A common question in forensic analysis is whether two observed data sets originated from the same source or from different sources. Statistical approaches to addressing this question have been widely adopted within the forensics community, particularly for DNA evidence. Here we investigate the application of statistical approaches to same-source forensic questions for spatial event data, such as determining the likelihood that two sets of observed GPS locations were generated by the same individual. We develop two approaches to quantify the strength of evidence in this setting. The first is a likelihood ratio approach based on modeling the spatial event data directly. The second approach is to instead measure the similarity of the two observed data sets via a score function and then assess the strength of the observed score resulting in the score-based likelihood ratio. A comparative evaluation using geolocated Twitter event data from two large metropolitan areas shows the potential efficacy of such techniques.
Implementation of a Blind Quality Control Program in a Forensic Laboratory
A blind quality control (QC) program was successfully developed and implemented in the Toxicology, Seized Drugs, Firearms, Latent Prints (Processing and Comparison), Forensic Biology, and Multimedia (Digital and Audio/Video) sections at the Houston Forensic Science Center (HFSC). The program was put into practice based on recommendations set forth in the 2009 National Academy of Sciences report and is conducted in addition to accreditation required annual proficiency tests. The blind QC program allows HFSC to test its entire quality management system and provides a real‐time assessment of the laboratory’s proficiency. To ensure the blind QC cases mimicked real casework, the workflow for each forensic discipline and their evidence submission processes were assessed prior to implementation. Samples are created and submitted by the HFSC Quality Division to whom the expected answer is known. Results from 2015 to 2018 show that of the 973 blind samples submitted, 901 were completed, and only 51 were discovered by analysts as being blind QC cases. Implementation data suggests that this type of program can be employed at other forensic laboratories.
Comparison of three similarity scores for bullet LEA matching
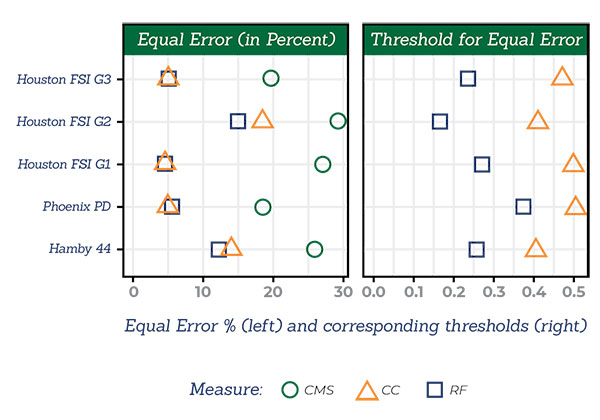
Recent advances in microscopy have made it possible to collect 3D topographic data, enabling more precise virtual comparisons based on the collected 3D data as a supplement to traditional comparison microscopy and 2D photography. Automatic comparison algorithms have been introduced for various scenarios, such as matching cartridge cases[1],[2] or matching bullet striae[3],[4],[5]. One key aspect of validating these automatic comparison algorithms is to evaluate the performance of the algorithm on external tests, that is, using data which were not used to train the algorithm. Here, we present a discussion of the performance of the matching algorithm[6] in three studies conducted using different Ruger weapons. We consider the performance of three scoring measures: random forest score, cross correlation, and consecutive matching striae (CMS) at the land-to-land level and, using Sequential Average Maxima scores, also at the bullet-to bullet level. Cross correlation and random forest scores both result in perfect discrimination of same-source and different-source bullets. At the land-to-land level, discrimination for both cross correlation and random forest scores (based on area under the curve, AUC) is excellent (≥0.90).
Insights: Error Rates, Likelihood Ratios, and Jury Evaluation of Forensic Evidence
Error Rates, Likelihood Ratios, and Jury Evaluation of Forensic Evidence
Forensic examiners regularly testify in criminal cases, informing the jurors whether crime scene evidence likely came from a source. In this study, we examine the impact of providing jurors with testimony further qualified by error rates and likelihood ratios, for expert testimony concerning two forensic disciplines: commonly used fingerprint comparison evidence and a novel technique involving voice comparison. Our method involved surveying mock jurors in Amazon Mechanical Turk (N = 897 laypeople) using written testimony and judicial instructions. Participants were more skeptical of voice analysis and generated fewer “guilty” decisions than for fingerprint analysis (B = 2.00, OR = 7.06, p =.
The Costs and Benefits of Forensics
Supreme Court Justice Louis Brandeis famously wrote that states can be laboratories for experimentation in law and policy. Disappointingly, however, the actual laboratories that states and local governments run are not a home for experimentation. We do not have adequate information about either the costs or the benefits of forensic testing or allocation of resources. Increased spending and expansion of crime laboratories has perversely accompanied growing backlogs. Poor quality control has resulted in a series of audits and even closures of crime laboratories. In response to these problems, however, some laboratories and some entire states have developed new approaches toward oversight. In this Article, I will describe the growth of crime labs and the resources dedicated to them, but also the backlogs that have resulted from far too much in the way of quantity. Second, I will discuss the problem of resource allocation in forensics, including the differing perspectives and interests of police and forensic agencies that should both be taken into account. Third, I will describe quality control challenges that have accompanied the explosion in the use of forensics. Fourth, I will describe how regulation could better address both resource allocation and quality control, as well as how the Houston Forensic Science Center has become a model for regulating both the quality and the quantity of forensics. Finally, I will ask why the federal government has not done more to help improve the quality of forensics even as it has helped to encourage overwhelming and unnecessary quantity.
Insights: Comparison of three similarity scores for bullet LEA matching
How do latent print examiners perceive proficiency testing? An analysis of examiner perceptions, performance, and print quality
Proficiency testing has the potential to serve several important purposes for crime laboratories and forensic science disciplines. Scholars and other stakeholders, however, have criticized standard proficiency testing procedures since their implementation in laboratories across the United States. Specifically, many experts label current proficiency tests as non-representative of actual casework, at least in part because they are not sufficiently challenging (e.g., [1], [2], [3], [4]. In the current study, we surveyed latent print examiners (n = 322) after they completed a Collaborative Testing Services proficiency test about their perceptions of test items. We also evaluated respondents’ test performance and used a quality metric algorithm (LQMetrics) to obtain objective indicators of print quality on the test. Results were generally consistent with experts’ concerns about proficiency testing. The low observed error rate, examiner perceptions of relative ease, and high objective print quality metrics together suggest that latent print proficiency testing is not especially challenging. Further, examiners indicated that the test items that most closely resembled real-world casework were also the most difficult and contained prints of the lowest quality. Study findings suggest that including prints of lower quality may increase both the difficulty and representativeness of proficiency testing in latent print examination.