Insights: Surveying Practicing Firearms Examiners

INSIGHTS

Surveying Practicing Firearms Examiners

OVERVIEW

In recent years, there has been much discussion and debate regarding firearm examiner testimony, but little is known empirically about the actual practices of firearm examiners in conducting casework. Researchers funded by CSAFE conducted a survey of practicing firearms examiners to better understand the conditions of their casework, as well as their views of the field and its relations with other parts of the justice system.

Lead Researchers

Nicholas Scurich
Brandon L. Garrett
Robert M. Thompson

Journal

Forensic Science International: Synergy

Publication Date

2022

Publication Number

IN 127 IMPL

Goals

1

Gain insights into the day-to-day casework and lab procedures of firearms examiners

2

Find what examiners believe impacts the quality of their work

3

Learn the examiners’ opinions of statistical models, new technology, and misunderstandings from judges and jurors in regard to their profession

The Study

Scurich et al. posted a survey on the Association of Firearms and Toolmark Examiners (AFTE) member forum from July to November of 2020. Participation was voluntary, anonymous, and uncompensated. A total of 79 AFTE members provided usable responses.

The survey asked about several topics, including:

Results

Frequency

What percentage of your cases result in an identification conlusion?

Frequency

What percentage of your cases result in an exclusion/elimination conlusion?

The percentage of identification results vs. elimination results

From the 79 responses, Scurich et al. learned the following:

Focus on the future


Further work should explore the impacts of lab policies and evidence submission practices on examiners.

New training and educational opportunities—for both firearm examiners and the consumers of firearm examiner testimony—could provide benefits and promote clearer understanding of the strengths and limitations of firearm examination.

WEBINAR Q&A: BLIND TESTING IN FIREARMS EXAMINATION: PRELIMINARY RESULTS, BENEFITS, LIMITATIONS, AND FUTURE DIRECTIONS

On June 23, the Center for Statistics and Applications in Forensic Evidence (CSAFE) hosted the webinar, Blind Testing in Firearms Examination: Preliminary Results, Benefits, Limitations, and Future Directions. It was presented by Maddisen Neuman, a Quality / Research Associate at the Houston Forensic Science Center (HSFC).

In the webinar, Neuman shares the methodology for HSFC’s blind proficiency testing program, as well as results from a recent study of 51 blind cases submitted to examiners between 2015 and 2021.

If you did not attend the webinar live, the recording is available at https://forensicstats.org/blog/portfolio/blind-testing-in-firearms-examination/

Why is blind testing important?

If an examiner knows they are being tested, results from a study can be skewed, so several governing bodies in the forensic science community recommend conducting blind proficiency tests to achieve more precise results. Researchers can do this by inserting test samples into the flow of casework so examiners do not know that they are being tested.

HSFC implemented its blind quality control program in 2015 and creates mock case evidence in house, with the goal of submitting test material at a rate of five percent of each section’s output from the year before.

Why is the advantage of having a blind testing program?

The biggest advantage is having a ground truth against which to compare examination results, which is not known in normal casework. Additionally, because examiners aren’t aware which cases are test cases, they perform the work as they would for a normal case. This allows researchers to observe the entire examination process, from evidence submission to the reporting of results.

How are firearms blind cases designed and submitted?

Blind cases mimic routine evidence and cases in order to appear authentic. The firearm used to create the fired evidence may or may not be submitted as an additional piece of evidence. Though HFSC has a large reference collection, blind tests are not created from this library as the examiners are likely to recognize the evidence. Some fired evidence is created using personal firearms from employees of HFSC.

HFSC researchers have also developed a partnership with the Houston Police Department (HPD), and regularly use firearms the property room division has slated for destruction to create mock evidence for blind testing. These firearms are often representative of the types of firearms seen frequently in casework.

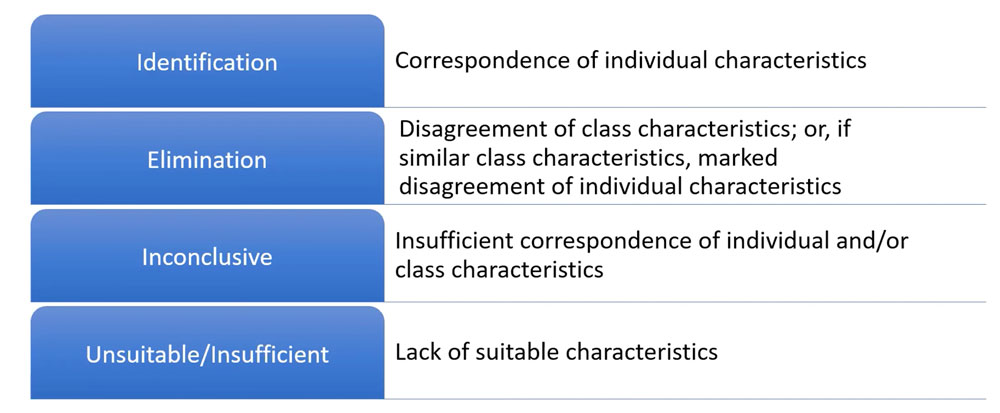
Fired evidence is then marked or documented in a way that relates it back to its corresponding firearm. Cartridge casings and bullet jackets are submitted with ground truths of either identification or elimination. Fragments and bullet cores are expected to be unsuitable or insufficient regardless of which firearm was used to create the evidence.

When a case is ready, it is packaged just like a regular firearms case would be, in an envelope or gun box. Technicians take the evidence to the HPD property room and prepare it with an HPD evidence bar code. The evidence stays there until HFSC makes a request for analysis, enlisting the help of HPD officers who use their names on the request, thus keeping the test blind. When the evidence arrives at HFSC for processing, it is assigned as usual by managers and supervisors who themselves do not know which evidence is real casework and which is test material.

What are the range of results expected from a blind proficiency firearms test?

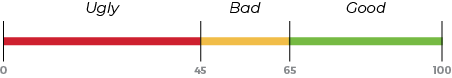
The range of results expected in HSFC’s blind proficiency test program follow the standard operating procedures widely used within the community. A condensed version of the results expected include:
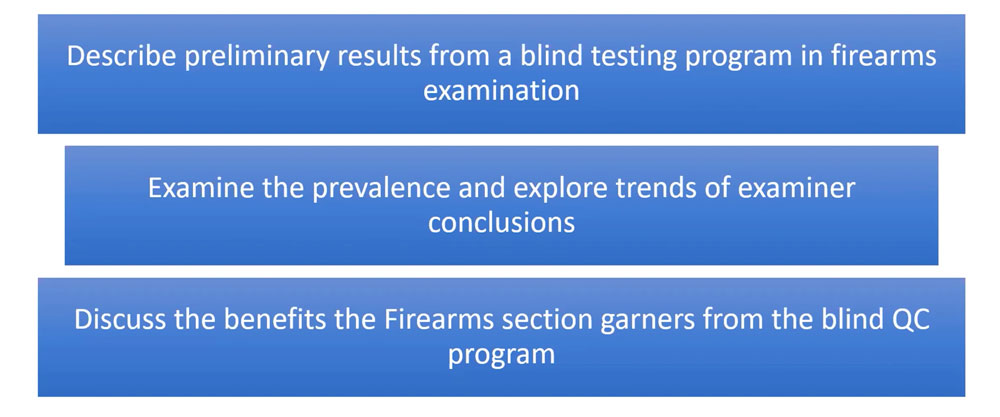
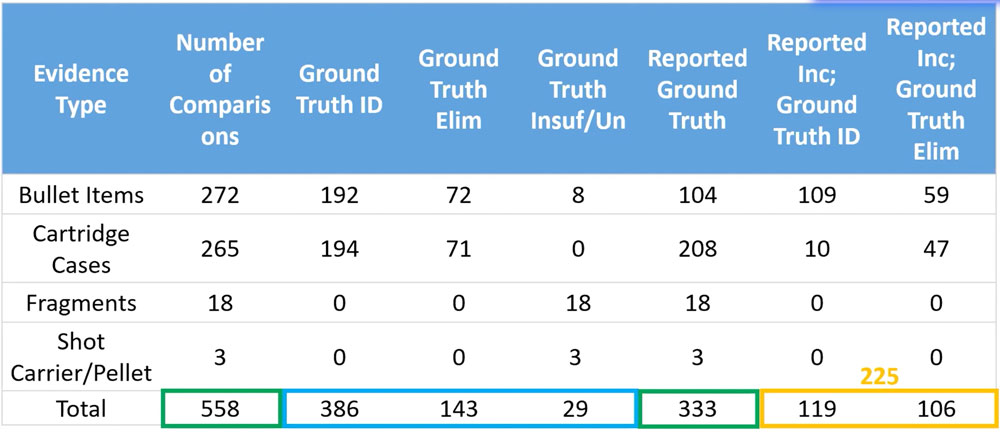
What are the objectives of HFSC’s blind proficiency tests?

What were the parameters and results of HSFC’s most recent study?

  • Test results were received from December 2015 to June 2021.
  • 51 cases were reported.
  • 460 items were examined.
  • 570 sufficiency and comparison conclusions were submitted, including:
    • 386 identification
    • 143 elimination
    • 29 insufficient/unsuitable
    • 12 items eliminated from study because ground truth could not be re-established after examination.
  • 11 examiners

Preliminary results

What are some trends in the results?

  • There was a 40 percent inconclusive rate throughout the course of the study.
  • There was a higher rate of inconclusive results when the ground truth was elimination (74 percent of elimination results reported inconclusive) as opposed a ground truth of identification (31 percent of identification results reported as inconclusive).
  • Bullets had a higher inconclusive rate than cartridge cases (62 versus 22 percent).
  • Inconclusive decisions were made in 86 percent of comparisons in which the evidence was created using two firearms of the same class.
  • Inconclusive decisions did not appear to be related to examiner pairings, experience, or the examiner’s training program.

What are the benefits of blind testing?

  • Blind tests provide a more controlled environment in which to examine inconclusive results.
  • Blind testing can gauge proficiencies in areas that normal proficiency tests don’t always cover (e.g., including evidence spanning cartridge cases, bullets, fragments, and firearms rather than just bullets or cartridge cases).
  • More challenging case scenarios can be created to test the examiners’ thresholds for conclusions.
  • Citing blind proficiency test results gives examiners the opportunity to bolster their credibility in court.

What are the next steps for HSFC’s blind testing program?

In the next phase of HSFC’s blind testing program, researchers would like to:

  • Compare the program’s inconclusive rates to those found in real casework.
  • Examine the consultation rate in the blind verification program.
  • Use blind cases for training new examiners and assessing new technology.
  • Collaborate with other labs and researchers to further this research.

WEBINAR Q&A: SHINING A LIGHT ON BLACK BOX STUDIES

Working on a Laptop

On April 22, the Center for Statistics and Applications in Forensic Evidence (CSAFE) hosted the webinar, Shining a Light on Black Box Studies. It was presented by Dr. Kori Khan, an assistant professor in the department of statistics at Iowa State University, and Dr. Alicia Carriquiry,

CSAFE director and Distinguished Professor and President’s Chair in Statistics at Iowa State.

In the webinar, Khan and Carriquiry used two case studies—the Ames II ballistics study and a palmar prints study by Heidi Eldridge, Marco De Donno, and Christophe Champod (referred to in the webinar as the EDC study)—to illustrate the common problems of examiner representation and high levels of non-response (also called missingness) in Black Box studies, as well as recommendations for addressing these issues in the future.

If you did not attend the webinar live, the recording is available at https://forensicstats.org/blog/portfolio/shining-a-light-on-black-box-studies/

What is Foundational Validity?

To start to understand Black Box studies, we must first establish foundational validity. The 2016 PCAST report brought Black Box studies into focus and defined them to be a thing of interest. The report detailed that in order for these feature comparison types of disciplines, we need to establish foundational validity, which means that empirical studies must show that, with known probability:

  • An examiner obtains correct results for true positives and true negatives.
  • An examiner obtains the same results when analyzing samples from the same types of sources.
  • Different examiners arrive at the same conclusions.

What is a Black Box Study?

The PCAST report proposed that the only way to establish foundational validity for feature comparison methods that rely on some amount of objective determination is through multiple, independent Black Box studies. In these studies, the examiner is supposed to be considered a “Black Box,” meaning there is some amount of subjective determination.

Method: Examiners are given test sets and samples and asked to render opinions about what their conclusion would have been if this was actual casework. Examiners are not asked about how they arrive at these conclusions. Data is collected and analyzed to establish accuracy. In a later phase, participants are given more data and their responses are again collected and then measured for repeatability and reproducibility.

Goal: The goal with Black Box studies is to analyze how well the examiners perform in providing accurate results. Therefore, in these studies, it is essential that ground truth be known with certainty.

What are the common types of measures in Black Box studies?

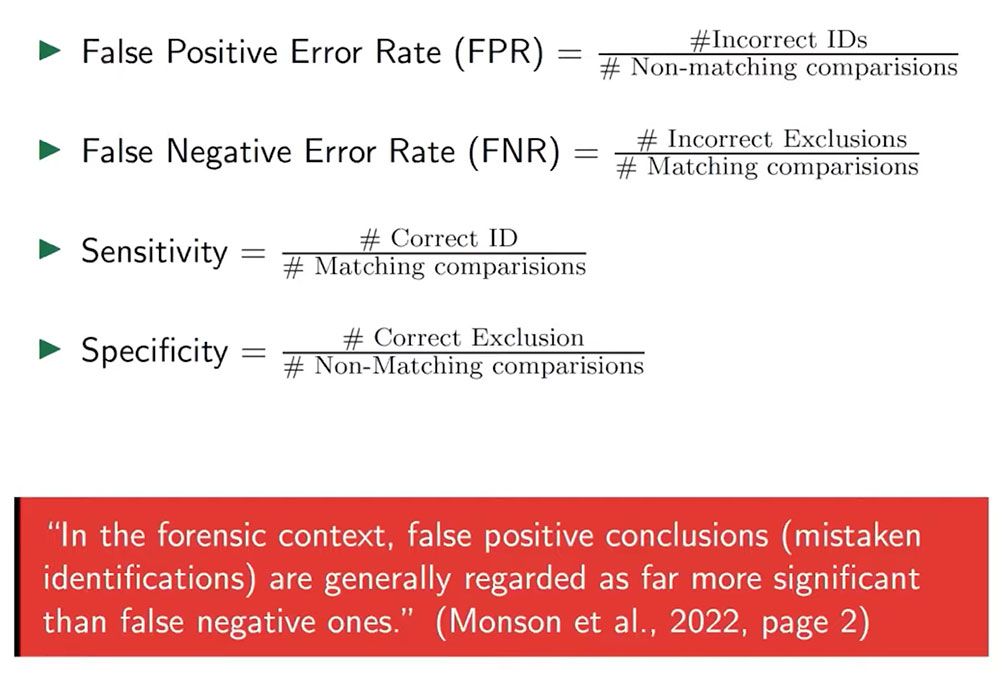
The four common types of measures are False Positive Error Rate (FPR), False Negative Error Rate (FNR), Sensitivity, and Specificity. Inconclusives are generally excluded from Black Box studies as neither an incorrect identification or incorrect exclusions, so inconclusive decisions are not treated as errors.

What are some common problems in some existing Black Box studies?

Representative Samples of Examiners

In order for results to reflect real-world scenarios, we need to ensure that the Black Box volunteer participants are representative of the population of interest. In an ideal scenario, volunteers are pulled from a list of persons within the population of interest, though this is not always possible.

All Black Box studies rely on volunteer participation, which can lead to self-selection bias, meaning those who volunteer are different from those who don’t. For example, perhaps those who volunteer are less busy than those who don’t volunteer. Therefore, it’s important that Black Box studies have inclusion criteria to help make the volunteer set as representative of the population of interest as possible.

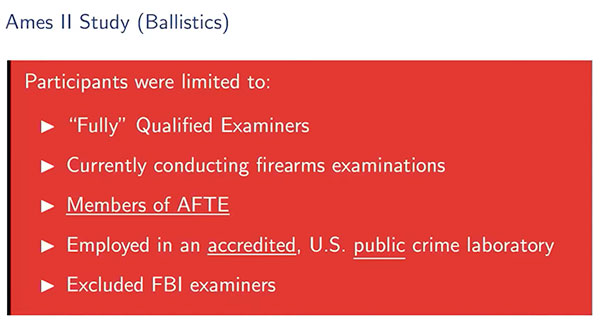
In the Ames II case study, volunteers were solicited through the FBI and the Association of Firearm and Toolmarks (AFTE) contact list. Participants were limited by the following criteria:

Problems with this set:

  • Many examiners do not work for an accredited U.S. public crime laboratory.
  • Many examiners are not current members of AFTE.

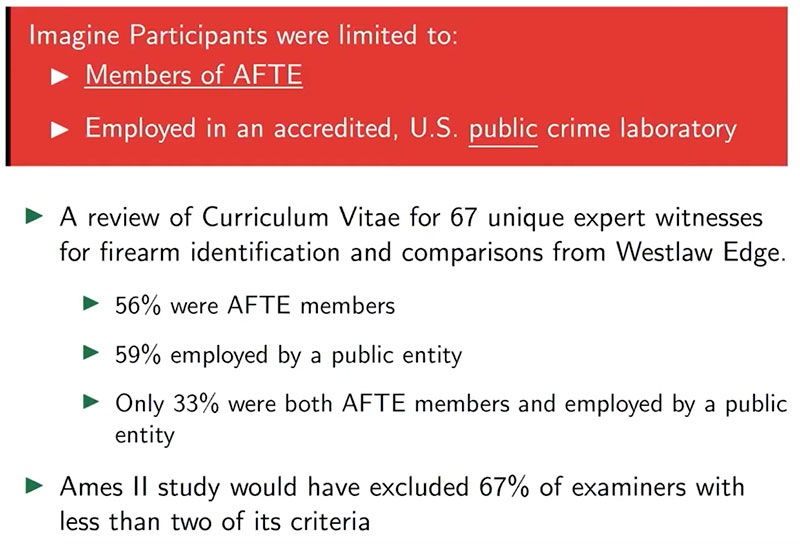
Overall, this is strong evidence in this study that the volunteer set does not match or represent the population of interest, which can negatively influence the accuracy of Black Box study results.

Handling Missing Data

Statistical literature has many rules of thumb stating that it is okay to carry out statistical analyses on the observed data if the missing data accounts for between 5–20% and the missingness is “ignorable”. If missingness is non-ignorable, any amount of missingness can bias estimates. Across most Black Box studies, missing data is between 30–40%. We can adjust for some non-response, but first we must know whether it’s ignorable or non-ignorable.

  • Adjusting for missing data depends on the missingness mechanism (potentially at two levels: unit and item).
  • Ignorable:
    • Missing Completely at Random: the probability that any observation is missing doew not depend on any other variable in the dataset (observed or unobserved)
    • Missing at Random: the probability that any observation is missing only depends on other observed variables.
  • Non-ignorable
    • Not Missing at Random (NMAR): The probability that any observation is missing depends on unobserved values. Also know as non-ignorable.

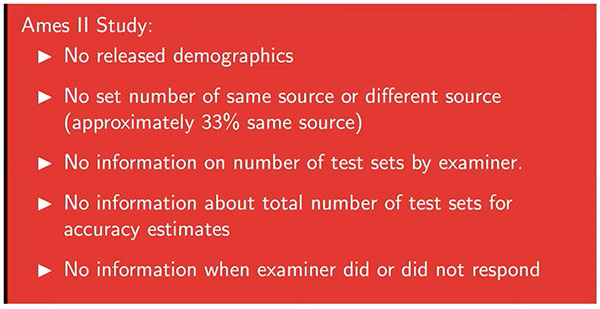
To make this determination, the following data at a minimum must be known:

  • The participants who enrolled and did not participate
  • The participants who enrolled and did participate
  • Demographics for each of these groups of examiners
  • The total number of test sets and types assigned to each examiner
  • For each examiner, a list of the items he/she did or did not answer
  • For each examiner, a list of the items he/she did or did not correctly answer

Most Black Box studies do not release this information or the raw data. For example:

However, study made much of the necessary data known, allowing researchers to study missingness empirically. If there is a characteristic of examiners that is associated with higher error rates, and if that characteristic is also associated with higher levels of missingness, we have evidence that the missingness is non-ignorable and can come up with ways to address it.

In this example, of the 226 examiners who returned some test sets in the studies, 197 of those also had demographic information. Of those 197, 53 failed to render a decision for over half of the 75 tests presented to them. The EDC study noted that examiners who worked for non-U.S. entities committed 50% of the false positives made in the study, but only accounted for less than 20% of the examiners. Researchers wanted to discover whether examiners who worked for non-U.S. entities had higher rates of missingness. After analyzing the data, researchers found that instead of the 19% of respondents that worked for non-U.S. entities that were expected to have a missingness of over half, the observed amount was 28% of respondents.

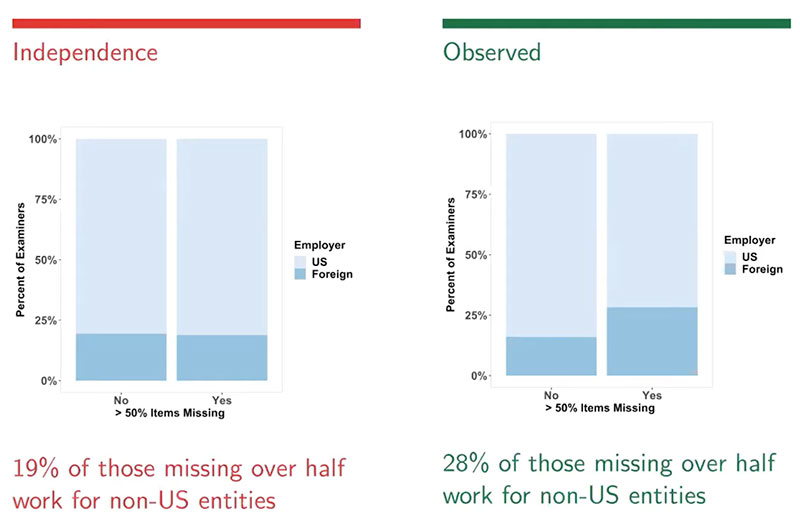
Researchers then conducted a hypothesis test to see if there was an association between working for a non-U.S. entity and missingness by taking a random sample size, calculating the proportion of foreign workers in the sample, repeating many times, and comparing the observed value of 28% to the calculated ones.

  • H0: Working for a non-US entity is statistically independent of missingness
  • HA: Working for a non-US entity is associated with a higher missingness

Using this method, researchers found that the observed result (28%) would occur only 4% of the time, if there was no relationship between missingness and working for a non-U.S. entity, meaning that there is strong evidence that working for a non-U.S. entity is associated with higher missingness.

Researchers repeated the process to test whether missingness is higher among examiners who did not work for an accredited lab and had similar findings:

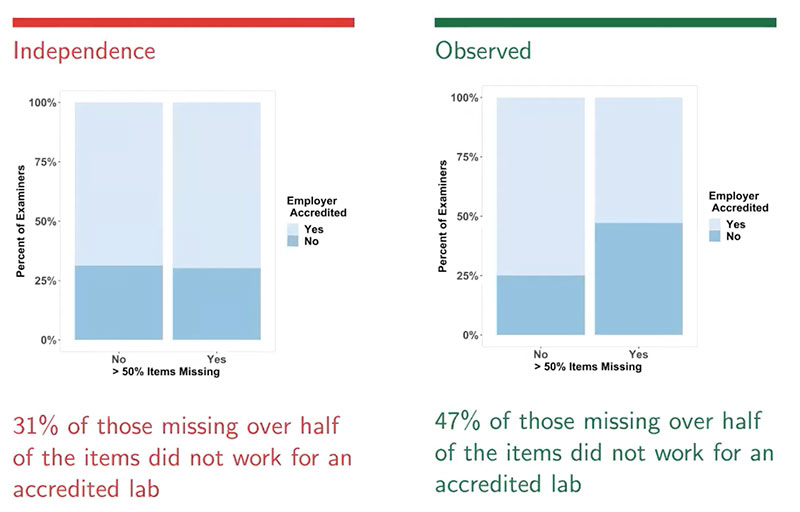
In this case, the hypothesis showed that his result (47% missingness) would only be expected about 0.29% of the time. Therefore, there is strong evidence that working for an unaccredited lab is associated with a higher missingness.

What are the next steps for gaining insights from Black Box studies?

The two issues discussed in this webinar—lack of a representative sample of participants and non-ignorable non-response—can be addressed in the short term with minor funding and cooperation among researchers.

Representation

  • Draw a random sample of courts (state, federal, nationwide, etc.)
  • Enumerate experts in each
  • Stratify and sample experts
  • Even if the person refuses to participate, at least we know in which ways (education, gender, age, etc.) the participants are or are not representative of the population of interest.

Missingness

  • This is producing the biggest biases in the studies that have been published.
  • Adjusting for non-response is necessary for the future of Black Box studies.
  • Results can be adjusted if those who conduct the studies release more data and increase transparency to aid collaboration.

Longer term solutions include:

  • Limiting who qualifies as an “expert” when testifying in court (existing parameters require minimal little to no certification, education, or testing)
  • Institutionalized, regular discipline-wide testing with expectations of participation.
  • Requirements to share data from Black Box studies in more granular form.

Insights: The Effect of Image Descriptors on the Performance of Classifiers of Footwear Outsole Image Pairs

INSIGHT

The Effect of Image Descriptors on the Performance of Classifiers of Footwear Outsole Image Pairs

OVERVIEW

Shoe prints left at a crime scene can often be partially observed, smudgy, or subject to background effects such as dirt or snow, which can make comparing prints to a reference image challenging. Similarly, prints from the same shoe can vary depending on the wearer’s gait, weight and activity during the time of impression. Reliable, qualitative methods have yet to be developed for visually assessing the similarity between impressions. To help develop such methods, researchers funded by CSAFE created an algorithm that extracts image descriptors (well-defined groups of pixels), then tested the algorithm by comparing simulated crime scene images to a study database.

Lead Researchers

Soyoung Park 
Alicia Carriquiry

Journal

Forensic Science International

Publication Date

February 2022

Publication Number

IN 128 FW

The Goals

1

Develop a quantitative method for comparing shoe print images.

2

Test this method’s performance against an existing “standard” method to quantify similarity between two images.

The Study

Park and Carriquiry created a study database of impression images, using 48 pairs of shoes which had been worn by volunteers for six months. They then scanned the shoe prints, placing 0 to 10 sheets of paper between the shoes and the scanner to simulate levels of degradation. In all, the researchers obtained 864 reference images, and made 1,728 pairs of images to compare
half of which were mated (coming from the same shoe), and half non-mated.

Meanwhile, the researchers developed an algorithm to compare these pairs using image descriptors, which identify distinct groups of pixels in an image such as corners, lines and blobs. In particular, they used the SURF and KAZE descriptors to identify blobs, and the ORB descriptor to identify corners.

A mated pair of images, scanned at level 0 and level 10 degradation

Using six different combinations of descriptors, the researchers ran their comparisons to determine which model had the best balance of accuracy and computation efficiency, which is required in real-world situations. For a control, they used a proposed method called Phase-Only
Correlation (POC) to compare to the descriptor-based methods.

SURF (Speeded-Up Robust Feature): a descriptor which uses a box filter on integral images

KAZE: meaning “wind” in Japanese, the name refers to the descriptor’s use of nonlinear diffusion filtering

ORB (Oriented FAST and Rotated BRIEF): a combination of two extraction methods, FAST (Features from Accelerated Segment Test) and BRIEF (Binary Robust Independent Elementary Features)

Results

Degradation Level 10

1

All tested models showed promise, with good quality images reaching accuracy of 95% or better, and even blurry images achieving accuracy of 85% to 88%.

2

The models that relied on the SURF and KAZE descriptors outperformed those that relied on ORB.

3

In comparison, the POC model failed to differentiate between mated and non-mated pairs.

Focus on the future


There is a lack of large databases with realistic footwear impressions. A larger database, with different brands and models of shoes, may help develop more robust algorithms for wider use.

Algorithms will likely never replace well-trained examiners, but the more accurate and efficient these algorithms become, the more useful they can be to examiners in their work.

Insights: Score-Based Likelihood Ratios for Camera Device Identification

INSIGHTS

Score-Based Likelihood Ratios for Camera Device Identification

OVERVIEW

In the developing field of digital image forensics, it is important to be able to identify cameras and other digital devices involved in crimes. However, current camera identification methods fail to quantify the strength of evidence, making it challenging for such evidence to withstand scrutiny in courts. Researchers funded by CSAFE propose using Score-Based Likelihood Ratios to quantify the weight of evidence in digital camera identification.

Lead Researchers

Stephanie Reinders, PhD
Yong Guan, PhD
Danica Ommen, PhD
Jennifer Newman, PhD

Journal

Journal of Forensic Sciences

Publication Date

6 February 2022

Publication Number

IN 126 STAT

Goals

1

Create Score-Based Likelihood Ratios (SLRs) to evaluate the strength of camera identification evidence

2

Compare different SLR models to determine which is the most accurate

The Study

All cameras have small manufacturing imperfections that cause slight variations among pixels in the camera sensor array. These imperfections are known as Photo-Response Non-Uniformities (PRNUs), which create a sort of “camera fingerprint” on images taken with that camera. These PRNUs can be used to identify the device used for a questioned image.

Reinders et al. used a dataset of 4,800 images from a total of 48 known camera devices. They then calculated a similarity score (notated as Δ) between questioned images (Q) and the PRNUs (K) of each camera.

From this, they constructed three different SLRs, each meant to determine the likelihood that a questioned image Q and Person of Interest’s camera’s PRNU K came from the same camera (hypothesis Hp), compared to the likelihood that Q and K came from different cameras (hypothesis Hd).

The three constructed SLR equations

Trace-Anchored SLR: Considers similarity scores between a questioned sample of evidence and samples from the alternative population

Source-Anchored SLR: Considers similarity scores between samples from a specific known source and samples from the alternative population

General Match SLR: Considers similarity scores between samples from randomly selected sources

RESULTS

Focus on the future


The data used in this study was a closed set, where all images came from the same known 26 devices, and were RAW, center-cropped, auto-exposure, and landscape orientation. Future studies may include an open set, with a larger variety of devices and image types, which may yield different results.

Several researchers have employed an “Inconclusive Zone” that does not result in a definitive match or non-match. This could be included in future studies, and if used in courts, could put further burden of proof on the prosecution and greater benefit of the doubt for the defense.

Insights: A Practical Tool for Information Management in Forensic Decisions

INSIGHTS

A Practical Tool for Information Management in Forensic Decisions:

Using Linear Sequential Unmasking-Expanded (LSU-E) in Casework

OVERVIEW

While forensic analysts strive to make their findings as accurate and objective as possible, they are often subject to external and internal factors that might bias their decision making. Researchers funded by CSAFE created a practical tool that laboratories can use to implement Linear Sequential Unmasking-Expanded (LSU-E; Dror & Kukucka, 2021)—an information management framework that analysts can use to guide their evaluation of the information available to them. LSU-E can improve decision quality and reduce bias but, until now, laboratories and analysts have
received little concrete guidance to aid implementation efforts.

Lead Researchers

Quigley-McBride, A.
Dror, I.E.
Roy, T.
Garrett, B.L.
Kukucka, J.

Journal

Forensic Science International: Synergy

Publication Date

17 January 2022

Publication Number

IN 125 IMPL

Goals

1

Identify factors that can bias decision-making.

2

Describe how LSU-E can improve forensic decision processes and conclusions.

3

Present a practical worksheet, as well as examples and training materials, to help laboratories incorporate LSU-E into their casework.

TYPES OF COGNITIVE BIAS

Cognitive biases can emerge from a variety of sources, including:

Figure 1. Eight sources of cognitive bias in forensic science (Dror, 2020)

COGNITIVE BIAS IN FORENSIC SCIENCE

As shown in Figure 1, there are many potential sources of information that can influence analysts’ decisions. Of particular concern is suggestive, task-irrelevant contextual information (such as a suspect’s race, sex, or prior criminal record) that can bias analyst’s decisions in inappropriate ways.

In one famous example, FBI latent print analysts concluded with “100 percent certainty” that a print linked to the 2003 Madrid train bombing belonged to a US lawyer, Brandon Mayfield. It transpired that these analysts were all wrong—that was not Mayfield’s print. Mayfield was Muslim, which might have biased the analysts given the strong, widespread attitudes towards Muslims post 9/11. Also, Mayfield was on the FBI’s “watch list” because he provided legal representation to someone accused of terrorist activities. Combined, these facts led to confirmation bias effects in the analysts’ evaluations and conclusions about Mayfield’s fingerprints.

LSU-E AND INFORMATION
MANAGEMENT

LSU-E is an approach information management which prioritizes case information based on three main criteria:

Biasing power:

How strongly the information might dispose an analyst to a particular conclusion.

Objectivity:

The extent to which the information might be interpreted to have different “meanings” from one analyst to another.

Relevance:

the degree to which the information is essential to the analytic task itself.

IMPLEMENTING LSU-E IN
FORENSICS

Quigley-McBride et al. have created a practical worksheet for laboratories to use when assessing new information.

1

First, the user specifies the information in question and its source

2

Second, they consider the three LSU-E criteria, and rate the information on a scale of 1-5 for each criterion

3

Finally, they describe strategies to minimize any adverse effects the information may have on the decision-making process

Focus on the future


Ideally, LSU-E procedures would be applied before the information reaches the analyst. That said, it is still effective when used at any point in the analyst’s workflow and can help analysts become aware of information that can inappropriately influence their work.

In addition to benefits for analysts, implementing LSU-E could help jurors evaluate the reliability of forensic expert testimony. This would not only encourage healthy skepticism among jurors, but could bolster an expert’s credibility by providing documentation of methods used to evaluate and mitigate potential biases in their decisions.

Insights: Handwriting Identification Using Random Forests and Score-Based Likelihood Ratios

INSIGHTs

Handwriting Identification Using Random Forests and Score-Based Likelihood Ratios

OVERVIEW

Handwriting analysis has long been a largely subjective field of study, relying on visual inspections from trained examiners to determine if questioned documents come from the same source. In recent years, however, efforts have been made to develop methods and software which quantify the similarity between writing samples more objectively. Researchers funded by CSAFE developed and tested a new statistical method for handwriting recognition, using a score-based likelihood
ratio (SLR) system to determine the evidential value.

Lead Researchers

Madeline Quinn Johnson
Danica M. Ommen

Journal

Statistical Analysis and Data Mining

Publication Date

03 December 2021

Publication Number

IN 124 HW

The Goals

1

Apply the SLR system to various handwritten documents.

2

Evaluate the system’s performance with various approaches to the data.

The Study

CSAFE collected handwriting samples from 90 participants, using prompts of various lengths to get samples of different sizes. These writing samples were broken down into graphs, or writing segments with nodes and connecting edges, then grouped into clusters for comparison.

When comparing the gathered samples, Johnson and Ommen considered two possible scenarios:

Common Source Scenario:

two questioned documents with unknown writers are compared to determine whether they come from the same source.

Specific Source Scenario:

a questioned document is compared to a prepared sample from a known writer.

They then used Score-based Likelihood Ratios (SLRs) to approximate the weight of the evidence in both types of scenarios.

The researchers used three different approaches when generating the known non-matching comparisons for the specific source SLRs:

Trace-Anchored Approach:

only uses comparisons between the questioned document (the trace) and a collection of writers different from the specific source (the background population).

Source-Anchored Approach:

only uses comparisons between writing from the specific source and the background population.

General-Match Approach:

only uses comparisons between samples from different writers in the background population.

Once the SLRs for each scenario were generated, they used random forest algorithms to determine comparison scores, including a pre-trained random forest using all of the gathered data, and one trained according to the relevant SLR.

Results

1

In common source scenarios, the trained random forest performed well with longer writing samples, but struggled with shorter ones.

2

The specific source SLRs performed better than the common source SLRs because they are tailored to the case at hand.

3

In all scenarios, it was more difficult for the SLR system to confirm samples with the same source than with different sources.

FOCUS ON THE FUTURE


The SLRs do not perform well with short documents, possibly due to a mismatch between the number of clusters used and the length of the document. Future work could determine the optimal number of clusters based on the document’s length.

Because the SLRs provide data on the strength of forensic handwriting evidence for an open-set of sources, this approach is an improvement on the previous clustering method developed by CSAFE, which used a closed set of known sources.

Insights: Using the Likelihood Ratio in Bloodstain Pattern Analysis

INSIGHTS

Using the Likelihood Ratio in Bloodstain Pattern Analysis

OVERVIEW

Using likelihood ratios (LRs) when reporting forensic evidence in court has significant advantages, as it allows forensic practitioners to consider their findings from the perspective of both the defense and the prosecution. However, despite many organizations adapting or recommending this practice, most experts in the field of bloodstain pattern analysis (BPA) still use a more traditional, subjective approach, indicating whether their findings are “consistent with” stated allegations. Researchers funded by CSAFE explored the challenges that come with using LRs when reporting BPA evidence, and proposed possible solutions to meet these challenges, concluding that the LR framework is applicable to BPA, but that it is a complex task.

Lead Researchers

Daniel Attinger
Kris De Brabanter
Christophe Champod

Journal

Journal of Forensic Sciences

Publication Date

29 October 2021

Publication Number

IN 123 BPA

Goals

1

Determine why many BPA experts do not use LRs in their reporting

2

Present directions the community could take to facilitate the use of LRs

3

Provide an example of how LRs are applied in a relevant field

CHALLENGES
OF USING LIKELIHOOD RATIOS

Likelihood ratios (LRs) compare two competing hypotheses to see which better fits the evidence. While this practice has several advantages for use in court, as it provides a more objective and transparent view of an expert’s findings, there are challenges when it comes to applying LRs to bloodstain pattern analysis.

Graph displaying factors that can affect the complexity of BPA

Attinger et al. identified two key factors affecting a likelihood ratio’s complexity:

This is further complicated by the nature of bloodstain pattern analysis itself. BPA focuses on questions of activity (how far, how long ago, in what direction the blood traveled) or the type of activity (what caused the blood pattern), rather than questions of source as is normal for most forensic LR models. In addition, BPA as a field consists of a wide range of methods, and is a complex science that is still being built.

EXAMPLE OF LIKELIHOOD
RATIOS IN ACTION

A recent study demonstrated how LRs could be used in BPA by applying them to the related field of fluid dynamics. In their test, they compared the time between the drying of a blood pool in a laboratory setting and one observed in photographs.

Using this model, they were able to create a physical model factoring in time, the scale and shape of the blood pool, and the surface on which the pool formed. This model could then be applied into a likelihood ratio, comparing propositions from the prosecution and defense.

In this instance, the defense’s proposition would be 2330 times more likely than the prosecution’s.

Focus on the future

Attinger et al. propose three directions to facilitate the use of LRs in the field of BPA:


Promote education and research to better understand the physics of fluid dynamics and how they relate to BPA

Create public databases of BPA patterns, and promote a culture of data sharing and peer review

Develop BPA training material that discusses LRs and their foundations

Insights: Latent Print Quality in Blind Proficiency Testing

INSIGHT

Latent Print Quality in Blind Proficiency Testing:

Using Quality Metrics to Examine Laboratory Performance

OVERVIEW

Organizations and leaders continuously call for blind proficiency testing in modern forensic labs because it more accurately simulates routine examiner casework. In response, researchers funded by CSAFE worked with the Houston Forensic Science Center to assess the results of their blind quality control program and then applied quality metrics to the test materials to see if the quality of the prints impacted their conclusions.

Lead Researchers

Brett O. Gardner
Maddisen Neuman
Sharon Kelley

Journal

Forensic Science International

Publication Date

May 7, 2021

Publication Number

IN 122 LP

THE GOALS

1

Examine the results of blind proficiency testing within a fingerprint examination unit of a crime laboratory.

2

Use available quality metrics software to measure the quality of the submitted prints.

3

See if there is an association between fingerprint quality and examiners’ conclusions.

The Studies

The Quality Division at the Houston Forensic Science Center inserted 376 prints into 144 blind test cases over a two-year period. In these cases, examiners determined if the prints were of sufficient quality to search in their Automated Fingerprint Identification System (AFIS). After searching AFIS for corresponding prints, they concluded whether or not the test prints were similar enough to make a Primary AFIS Association (PAA). Then, the Blind Quality Control (BQC) team judged the examiners’ accuracy.


Meanwhile, Gardner et al. entered the same test prints into LQMetrics –– a commonly used software tool for fingerprint examiners that rates the quality of a print image on a scale of 0–100. The team scored print images with a quality score greater than 65 as “Good,” 45–65 as “Bad,” and lower than 45 as “Ugly.”

Results

Examiner Conclusions Among Good, Bad and Ugly Latent Prints

Print quality (as categorized by Good, Bad and Ugly) was significantly associated with examiner conclusions and ultimate accuracy. Note: N = 373 prints. There were 133 Good prints, 114 Bad prints and 126 Ugly prints

FOCUS ON THE FUTURE


The correct source for prints submitted to AFIS appeared in the top ten results only 41.7% of the time, lower than an estimated 53.4% of the time based on the quality of such prints. This highlights the potential for blind proficiency testing to gauge the accuracy of the entire system –– including AFIS.

This study only included prints that had the potential to be submitted to AFIS, dismissing images not labeled as latent prints. Future studies should include a full range of images to more closely reflect real-world casework.

Insights: Recognition of Overlapping Elliptical Objects in a Binary Image

INSIGHTS

Recognition of Overlapping Elliptical Objects in a Binary Image

OVERVIEW

A common objective in bloodstain pattern analysis is identifying the mechanism that produced the pattern, such as gunshots or blunt force impact. Existing image-based methods often ignore overlapping objects, which can limit the number of usable stains. Researchers funded by CSAFE established a novel technique for image analysis to provide more accurate data.

Lead Researchers

Tong Zou
Tianyu Pan
Michael Taylor
Hal Stern

Journal

Pattern Analysis and Applications

Publication Date

4 May 2021

Publication Number

IN 121 BPA

Goals

1

Develop a method to classify shapes in complex images.

2

Apply this method to data of different types including bloodstain patterns.

3

Compare the new method’s accuracy to existing methods.

Approach and Methodology

When analyzing bloodstain patterns, the individual stains may appear as clumps comprised of overlapping objects (e.g., droplets). Zou et al. developed a new computational method that identifies the individual objects making up each clump. The method proceeds as follows:

1

Generate a large number of elliptical shapes that match the overall contours of the clump.

2

Use an empirical measure of fit to reduce the set of candidate ellipses.

3

Identify concave points in the clump’s contour and set up an optimization to determine the best fitting ellipses.

Image Processing

Examples of ellipse fitting results for synthetic data. (a) Original binary image; (b) Ground truth; (c) DEFA model; (d) BB model; (e) DTECMA. The number of true ellipses increases from 2 (leftmost column) to 9 (rightmost column). Rows (c) and (d) are results from existing methods; row (e) gives results for Zou et al.’s DTECMA algorithm.

The researchers tested the method on a set of over 1,600 test images with overlapping shapes, emulating bloodstains (row a).

Study Results

  • Across four different metrics, the new approach outperformed existing approaches.
  • The current methods struggled to correctly recognize shapes as the number of ellipses per picture grew. Only the new method was able to maintain consistent accuracy.

Examples of ellipse fitting results for synthetic data. (a) Original binary image; (b) Ground truth; (c) DEFA model; (d) BB model; (e) DTECMA. The number of true ellipses increases from 2 (leftmost column) to 9 (rightmost column). Rows (c) and (d) are results from existing methods; row (e) gives results for Zou et al.’s DTECMA algorithm.

Focus on the future


The new approach to identifying elliptical-shaped objects in complex images shows marked improvement over current methods. This is demonstrated using simulated data and biological data for which the underlying truth is known.

While these results are promising, there is currently no way to quantify the performance of these models for bloodstain pattern analysis. The paper shows that the new method seems to do well based on visual inspection.

The next stage of the research is to use the identified ellipses as summaries of the images that can be used to develop statistical methods for analyzing bloodstain patterns.