Insights: Implementing Blind Proficiency Testing in Forensic Laboratories

INSIGHT

Implementing Blind Proficiency Testing in Forensic Laboratories:

Motivation, Obstacles, and Recommendations

OVERVIEW

Accredited forensic laboratories are required to conduct proficiency testing –– but most rely solely on declared proficiency tests. A 2014 study showed that only 10% of forensic labs in the United States performed blind proficiency testing, whereas blind tests are standard in other fields including medical and drug testing laboratories. Researchers wanted to identify the barriers to widespread blind proficiency testing and generate solutions to removing these obstacles. After reviewing the existing research, they realized they must convene a meeting of experts to establish an understanding of the challenges to implementation.

Lead Researchers

Robin Mejia
Maria Cuellar
Jeff Salyards

Journal

Forensic Science International: Synergy

Publication Date

September 2020

Publication Number

IN 110 LP

Participants

CSAFE met with laboratory directors and quality managers from seven forensic laboratory systems in the eastern US and the Houston Forensic Science Center. Two of the quality managers represented the Association of Forensic Quality Assurance Managers (AFQAM). In addition, several professors, graduate students and researchers from three universities attended the meeting.

APPROACH AND METHODOLOGY

1

Compare blind proficiency testing to declared testing then have participants discuss the potential advantages of establishing blind testing as standard.

2

Facilitate and document a discussion of the logistical and cultural barriers labs might face when adopting blind testing. Use this to create a list of challenges.

3

Collect and analyze suggested steps labs can take to overcome the list of challenges to implementing blind proficiency testing.

Challenges and Solutions

Challenge Proposed Solution
Realistic test case creation can be complex.
Quality managers develop the expertise to create test cases; laboratories create a shared evidence bank.
The development of realistic submission materials may be difficult.
The QA staff must develop the knowledge locally to ensure the test evidence conforms with a jurisdiction’s typical cases.
Cost may be prohibitively expensive.
Multiple laboratories can share resources and make joint purchases; external test providers could develop materials to lower the cost.
Test must be submitted to the lab by an outside LEA.
Choosing which law enforcement agency (LEA) to work with should be decided locally based on the relationship between lab management and the LEA.
Not all LIMS are equipped to easily flag and track test cases.
Labs can choose to either use a Laboratory Information Management System (LIMS) with this functionality or develop an in-house system to flag test cases.
Labs must ensure results are not released as real cases.
The QA team will need to work with individuals in other units of the lab to prevent accidental releases. It may also be useful to have contacts in the submitting LEA or local District Attorney’s office.
Proficiency tests could impact metrics, so labs need to decide whether to include them.
These decisions must be made on a lab-by-lab basis; a consortium of labs or organizations such as AFQAM can aid in standardization.
Blind testing challenges the cultural myth of 100% accuracy.
Senior lab management must champion blind testing and show that adding it as a tool will demonstrate both the quality of examiners and help labs discover and remedy errors.

Learn More


Watch the HFSC webinar, “Crime Lab Proficiency and Quality Management.”

Dr. Robin Mejia discusses “Implementing Blind Proficiency Testing” in the CSAFE webinar

Statistical Methods for the Forensic Analysis of User-Event Data

A common question in forensic analysis is whether two observed data sets originate from the same source or from different sources. Statistical approaches to addressing this question have been widely adopted within the forensics community, particularly for DNA evidence, providing forensic investigators with tools that allow them to make robust inferences from limited and noisy data. For other types of evidence, such as fingerprints, shoeprints, bullet casing impressions and glass fragments, the development of quantitative methodologies is more challenging. In particular, there are significant challenges in developing realistic statistical models, both for capturing the process by which the evidential data is produced and for modeling the inherent variability of such data from a relevant population.

In this context, the increased prevalence of digital evidence presents both opportunities and challenges from a statistical perspective. Digital evidence is typically defined as evidence obtained from a digital device, such as a mobile phone or computer. As the use of digital devices has increased, so too has the amount of user-generated event data collected by these devices. However, current research in digital forensics often focuses on addressing issues related to information extraction and reconstruction from devices and not on quantifying the strength of evidence as it relates to questions of source.

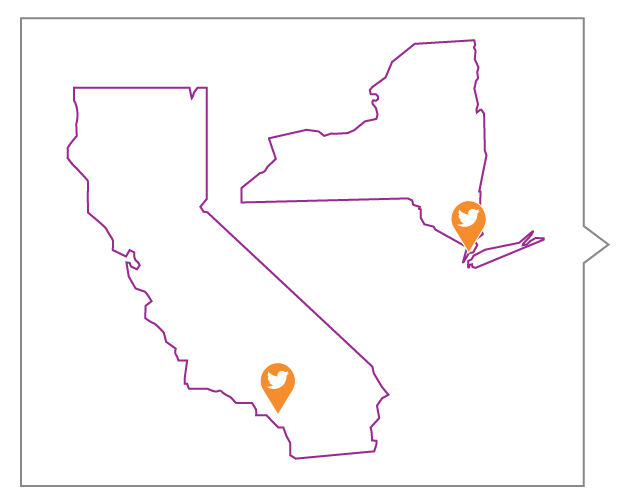
This dissertation begins with a survey of techniques for quantifying the strength of evidence (the likelihood ratio, score-based likelihood ratio and coincidental match probability) and evaluating their performance. The evidence evaluation techniques are then adapted to digital evidence. First, the application of statistical approaches to same-source forensic questions for spatial event data, such as determining the likelihood that two sets of observed GPS locations were generated by the same individual, is investigated. The methods are applied to two geolocated event data sets obtained from social networks. Next, techniques are developed for quantifying the degree of association between pairs of discrete event time series, including a novel resampling technique when population data is not available. The methods are applied to simulated data and two real-world data sets consisting of logs of computer activity and achieve accurate results across all data sets. The dissertation concludes with suggestions for future work.

Insights: A Clustering Method for Graphical Handwriting Components and Statistical Writership Analysis

INSIGHT

A Clustering Method for Graphical Handwriting Components and Statistical Writership Analysis

OVERVIEW

Researchers developed and tested a statistical algorithm for analyzing the shapes made in handwriting to determine their source. Unlike other programs that analyze what words are written, this algorithm analyzes how the words are written.

Lead Researchers

Amy M. Crawford
Nicholas S. Berry
Alicia L. Carriquiry

Journal

Statistical Analysis and Data Mining

Publication Date

August 2020

Publication Number

IN 109 HW

The Goals

1

Develop a semi-automated process to examine and compare handwriting samples from questioned and reference documents.

2

Improve upon the existing methodology for determining writership.

APPROACH AND METHODOLOGY

In this study, researchers scanned and analyzed 162 handwritten documents by 27 writers from the Computer Vision Lab database, a publicly available source of handwritten text samples, and broke down the writing into 52,541 unique graphs using the processing program handwriter. From there, a K-means algorithm clustered the graphs into 40 groups of similar graphs, each anchored by a mean or center graph. To allocate graphs to groups, researchers developed a new way to measure the distance between graphs.

Then, researchers processed an additional document from each of the 27 writers –– held back as a “questioned document” –– to test if the algorithm could accurately determine which document belonged to which writer. The new method for clustering graphs appears to be an improvement over the current approach based on adjacency grouping,
which relies only on edge connectivity of graphs.

using adjacent clustering

above 50% probability of a match on 23 documents

using dynamic K-means clustering

above 90% probability of a match on 23 documents

correctly matched 26 documents

Key Definitions

Graphs

Simple structures with nodes and edges to represent shapes that constitute handwriting

Writership

The set of graphs a person typically makes when writing

K-means Algorithm

An iterative algorithm that separates data points into clusters based on nearest mean values

KEY TAKEAWAYS FOR PRACTITIONERS

1

The new approach shows promise, as it allows practitioners to more objectively analyze
handwriting by studying the way letters and words are formed.

2

When compared to the more readily available but more volatile adjacency grouping
method, the K-means clustering method contributed to greater accuracy when trying to
identify the writer of a questioned document from among a closed set of potential writers.

FOCUS ON THE FUTURE


The new method favors certain properties of handwriting over others to assess similarities and can be extended to incorporate additional features.

The mean of a group of graphs is often a shape that does not actually occur in the document. Instead of centering groups using a mean graph, researchers are exploring whether using an exemplar graph as a group’s anchor will simplify calculations.

Next Steps

Handwriter

Explore and try the handwriter algorithm by downloading it

CSAFE Handwriting Database

Investigate publicly available databases of handwritten documents

Computer Vision Lab database

Investigate publicly available databases of handwritten documents

Insights: Statistical Methods for the Forensic Analysis of Geolocated Event Data

INSIGHT

Statistical Methods for the Forensic Analysis of Geolocated Event Data

OVERVIEW

Researchers investigated the application of statistical methods to forensic questions involving spatial event-based digital data. A motivating example involves assessing whether or not two sets of GPS locations corresponding to digital events were generated by the same source. The team established two approaches to quantify the strength of evidence concerning this question.

Lead Researchers

Christopher Galbraith
Padhraic Smyth
Hal S. Stern

Journal

Forensic Science International: Digital Investigation

Publication Date

July 2020

Publication Number

IN 108 DIG

The Goal

Develop quantitative techniques for the forensic analysis of geolocated event data.

APPROACH AND METHODOLOGY

Researchers collected geolocation data from Twitter messages over two spatial regions, Orange County, CA and the borough of Manhattan in New York City, from May 2015 to February 2016. Selecting only tweets from public accounts, they were able to gather GPS data regarding the frequency of geolocated events in each area.

Key Definitions

Likelihood Ratio (LR)

A comparison of the probability of observing a set of evidence measures under two different theories in order to assess relative support for the theories.

Score-Based Likelihood Ratio (SLR)

An approach that summarizes evidence measures by a score function before applying the likelihood ratio approach.

This study considered a scenario in which two sets of tweet locations are relevant to then determine the source of the tweets. The tweets could be from different devices or from the same device during two different time periods.

The team used kernel density estimation to establish a likelihood ratio approach for observing the tweets under two competing hypotheses: are the tweets from the same source or a different source?

Utilizing this second approach creates a score-based likelihood ratio that summarizes the similarity of the two sets of locations while assessing the strength of the evidence.

Decisions based on both LR and SLR approaches were compared to known ground truth to determine true and false-positive rates.

KEY TAKEAWAYS FOR PRACTITIONERS

1

Both methods show promise in being able to distinguish same-source pairs of spatial event data from different-source pairs.

2

The LR approach outperformed the SLR approach for all dataset sizes considered.

3

The behavior of both approaches can be impacted by the characteristics of the observed region and amount of evidential data available.

FOCUS ON THE FUTURE


In this study, time defined sets of locations gathered from Twitter. But, other methods for defining sets of locations, for example, including multiple devices over the same time period, could yield different results.

The amount of available data (the number of tweets) impacts the score-based approach.

NIST Seeks Digital Forensics Experts to Participate in Vital ‘Blackbox’ Study

Objectivity and accuracy are the pinnacle of forensic science. Yet everyone can agree: humans make errors — but to what degree when it comes to digital forensic evidence-gathering and analysis?

The National Institute of Standards and Technology (NIST) is launching the first “blackbox” research study to quantify the accuracy of computer and mobile phone forensics and answer this question.

Digital evidence provides an additional layer of potential human error, especially taking into consideration rapidly evolving technologies, and situations when key evidence must be identified and extracted from large volumes of digital data. It is for these reasons that CSAFE too has is working on a mobile app analysis tool EVIHUNTER.

On a broader scale, this NIST study acts as an answer to the 2009 National Academy of Sciences report: Strengthening Forensic Science in the United States: A Path Forward, which calls for blackbox studies to measure reliability of forensic methods that involve human judgement.

Digital evidence, though grounded in technology, certainly relies on the human element. By participating in the NIST study, digital forensic practitioners can help strengthen the future of forensic science by providing a foundation of quantitative probability that can be used by courts and jurors to weigh the validity of presented digital evidence and analysis — as well as inform future studies needed in this realm. Digital forensic experts can answer a question paramount to fulfilling their own goals and missions in their positions: Are our industry sector’s methods accurate and reliable?

The Study Details

Blackbox studies are unique in their anonymity. They assess the reliability and accuracy (right or wrong) of human judgement methods only, without concern for how experts reached their answer. Therefore, the study will not judge individuals and their performance but rather will be aimed to measure the performance of the digital forensics community as a whole.

The study will be conducted online — and enrollment is now open and the test is available for approximately three months.

Digital forensic experts who volunteer for the study will be provided a download of simulated evidence from the NIST website, in the form of one virtual mobile phone and one virtual computer. In roughly a two-hour time commitment, participants will be asked to examine simulated digital evidence and answer a series of questions similar to those that would be expected in a real criminal investigation. Participants will use forensic software tools of their choosing to analyze the forensic images.

Who Can Participate

All public and private sector digital examiners who conduct hard drive or mobile phone examinations as part of their official duties are encouraged to volunteer and participate in this study.

No one individual’s performance or laboratory will be calculated. Rather, NIST will publish anonymized and comprehensive results of the overall performance of the digital forensic expert community and different sectors within that community.

To learn more or to enroll in this vital study to advancing digital forensics forward, visit NIST Blackbox Study for Digital Examiners and follow the simple steps to get started.


[Enroll in NIST Blackbox Study]

Hunting wild stego images, a domain adaptation problem in digital image forensics

Digital image forensics is a field encompassing camera identication, forgery detection and steganalysis. Statistical modeling and machine learning have been successfully applied in the academic community of this maturing field. Still, large gaps exist between academic results and applications used by practicing forensic analysts, especially when the target samples are drawn from a different population than the data in a reference database.

This thesis contains four published papers aiming at narrowing this gap in three different fields: mobile stego app detection, digital image steganalysis and camera identification. It is the first work to explore a way of extending the academic methods to real world images created by apps. New ideas and methods are developed for target images with very rich flexibility in the embedding rates, embedding algorithms, exposure settings and camera sources. The experimental results proved that the proposed methods work very well, even for the devices which are not included in the reference database.

Insights: Psychometric Analysis of Forensic Examiner Behavior

INSIGHT

Psychometric Analysis of Forensic Examiner Behavior

OVERVIEW

Understanding how fingerprint examiners’ proficiency and behavior influence their decisions when interpreting evidence requires the use of many analytical models. Researchers sought to better identify and study uncertainty in examiners’ decision making. This is because final source identifications still rely on complex and subjective interpretation of the evidence by examiners. By applying novel methods like Item Response Theory (IRT) to existing tools like error rate studies, the team proposes a new approach to account for differences among examiners and in task difficulty levels.

Lead Researchers

Amanda Luby
Anjali Mazumder
Brian Junker

Publication Date

June 13, 2020

Journal

Behaviormetrika

Publication Number

IN 107 LP

THE GOALS

1

Survey recent advances in psychometric analysis of forensic decision-making.

2

Use behavioral models from the field of Item Response Theory to better understand the operating characteristics of the identification tasks that examiners perform.

APPROACH AND METHODOLOGY

The Data

A 2011 FBI Black Box study assigned 169 fingerprint examiners a selection of items to analyze, which included a latent print evaluation, a source destination, a reason and a rating of the difficulty of the task for each pair of prints.

Key Definitions

Psychometrics

Using factors such as aptitudes and personality traits to study the difference between individuals.

Item Response Trees (IRTrees)

Visual representation of each decision an examiner makes in the process of performing an identification task. Based on IRT, which attempts to explain the connections between the properties of a test item –– a piece of fingerprint evidence –– and an individual’s –– a fingerprint examiner’s –– performance in response to that item.

Cultural Consensus Theory (CCT)

A method that facilitates the discovery and description of consensus among a group of people with shared beliefs. For this study, CCT helps identify the common knowledge and beliefs among fingerprint examiners –– things that examiners may take for granted but that laypeople would not necessarily know.

APPLYING IRTREES AND CCT TO FINGERPRINT ANALYSIS

1

Researchers segmented the data with the Rasch Model to separate a latent print’s difficulty level from an examiners’ proficiency. This allowed comparison to the existing method of studying error rates.

2

Then they constructed IRTrees to model a fingerprint examiner’s decision-making process when deciding whether a print is a positive match, negative match, inconclusive, or has no latent value. (See Figure 1)

3

Finally, the team used IRTrees and Cultural Consensus Theory to create “answer keys” –– a set of reasons and shared knowledge –– that provide insight into how a fingerprint examiner arrives at an “inconclusive” or “no value” decision. (See Figure 2)

Figure 1

Visual representation of latent print analysis

Figure 2

How examiners arrive at “inconclusive” or “no value” decisions

KEY TAKEAWAYS FOR PRACTITIONERS

1

Using IRT models provides substantial improvement over current examiner error rate studies. These include the ability to justifiably compare examiner proficiencies
even if they did not do the same identification tasks and that the influence of task difficulty can be seen in examiner proficiency estimates.

2

IRTrees give researchers the ability to accurately model the complex decision-making in fingerprint identification tasks –– it is much more than simply stating a print is a “match” or a “non-match.” This reveals the skill involved in fingerprint examination work.

3

Examiners tend to overrate the difficulty of middling-difficulty tasks, while underrating the difficulty of extremely easy or extremely difficult tasks.

FOCUS ON THE FUTURE


This analysis was somewhat limited by available data; for confidentiality and privacy considerations, the FBI Black Box Study does not provide the reference prints used nor the personal details of the examiners themselves. Future collaboration with experts, both in fingerprint analysis and human decision making, can provide more detailed data and thus improve the models.

How Can a Forensic Result Be a ‘Decision’? A Critical Analysis of Ongoing Reforms of Forensic Reporting Formats for Federal Examiners

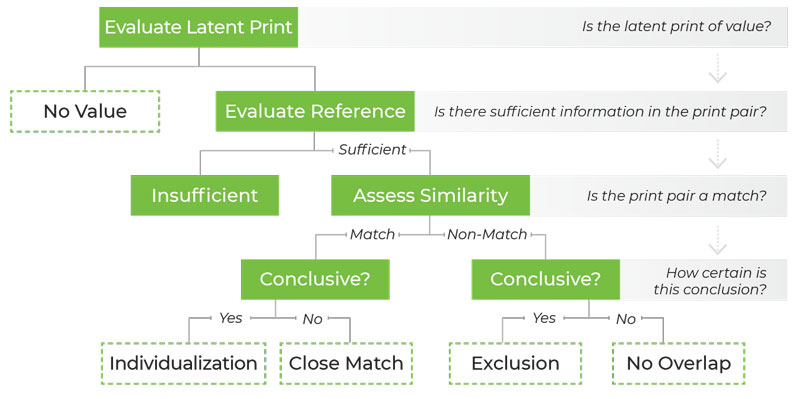
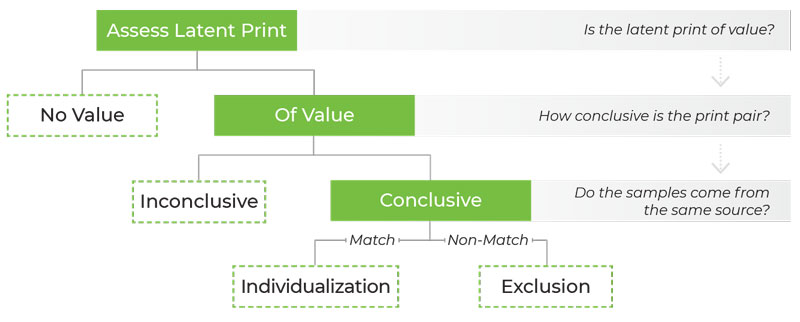
The decade since the publication of the 2009 National Research Council report on forensic science has seen the increasing use of a new word to describe forensic results. What were once called “facts,” “determinations,” “conclusions,” or “opinions,” are increasingly described as “decisions.” Prior to 2009, however, the term “decision” was rarely used to describe forensic results. Lay audiences, such as lawyers, might be forgiven for perceiving this as a surprising turn. In its plain English meaning, a “decision” would seem to be a strange word choice to describe the outcome of a scientific analysis, given its connotation of choice and preference. In this Article, we trace the recent history of the term “decision” in forensic analysis. We simply and clearly explain the scientific fields of “decision theory” and “decision analysis” and their application to forensic science. We then analyze the Department of Justice (DOJ) Uniform Language for Testimony and Reporting (ULTR) documents that use the term. We argue that these documents fail to articulate coherent frameworks for reporting forensic results. The Article identifies what we perceive to be some key stumbling blocks to developing such frameworks. These include a reluctance to observe decision theory principles, a reluctance to cohere with sound probabilistic principles, and a reluctance to conform to particular logical concepts associated with these theories, such as proper scoring rules. The Article elucidates each of these perceived stumbling blocks and proposes a way to move forward to more defensible reporting frameworks. Finally, we explain what the use of the term “decision” could accomplish for forensic science and what an appropriate deployment of the term would require.

Quantifying the similarity of 2D images using edge pixels: An application to the forensic comparison of footwear impressions

We propose a novel method to quantify the similarity between an impression (Q) from an unknown source and a test impression (K) from a known source. Using the property of geometrical congruence in the impressions, the degree of correspondence is quantified using ideas from graph theory and maximum clique (MC). The algorithm uses the x and y coordinates of the edges in the images as the data. We focus on local areas in Q and the corresponding regions in K and extract features for comparison. Using pairs of images with known origin, we train a random forest to classify pairs into mates and non-mates. We collected impressions from 60 pairs of shoes of the same brand and model, worn over six months. Using a different set of very similar shoes, we evaluated the performance of the algorithm in terms of the accuracy with which it correctly classified images into source classes. Using classification error rates and ROC curves, we compare the proposed method to other algorithms in the literature and show that for these data, our method shows good classification performance relative to other methods. The algorithm can be implemented with the R package shoeprintr.