Quantifying the association between discrete event time series with applications to digital forensics

We consider the problem of quantifying the degree of association between pairs of discrete event time series, with potential applications in forensic and cybersecurity settings. We focus in particular on the case where two associated event series exhibit temporal clustering such that the occurrence of one type of event at a particular time increases the likelihood that an event of the other type will also occur nearby in time. We pursue a non‐parametric approach to the problem and investigate various score functions to quantify association, including characteristics of marked point processes and summary statistics of interevent times. Two techniques are proposed for assessing the significance of the measured degree of association: a population‐based approach to calculating score‐based likelihood ratios when a sample from a relevant population is available, and a resampling approach to computing coincidental match probabilities when only a single pair of event series is available. The methods are applied to simulated data and to two real world data sets consisting of logs of computer activity and achieve accurate results across all data sets.

Score-based Likelihood Ratios for Camera Device Identification

Many areas of forensics are moving away from the notion of classifying evidence simply as a match or non-match. Instead, some use score-based likelihood ratios (SLR) to quantify the similarity between two pieces of evidence, such as a fingerprint obtained from a crime scene and a fingerprint obtained from a suspect. We apply trace-anchored score-based likelihood ratios to the camera device identification problem. We use photo-response non-uniformity (PRNU) as a camera fingerprint and one minus the normalized correlation as a similarity score. We calculate trace-anchored SLRs for 10,000 images from seven camera devices from the BOSSbase image dataset. We include a comparison between our results the universal detector method.

Algorithm mismatch in spatial steganalysis

The number and availability of stegonographic embedding algorithms continues to grow. Many traditional blind steganalysis frameworks require training examples from every embedding algorithm, but collecting, storing and processing representative examples of each algorithm can quickly become untenable. Our motivation for this paper is to create a straight-forward, nondata-intensive framework for blind steganalysis that only requires examples of cover images and a single embedding algorithm for training. Our blind steganalysis framework addresses the case of algorithm mismatch, where a classifier is trained on one algorithm and tested on another, with four spatial embedding algorithms: LSB matching, MiPOD, S-UNIWARD and WOW.

We use RAW image data from the BOSSbase database and and data collected from six iPhone devices. Ensemble Classifiers with Spatial Rich Model features are trained on a single embedding algorithm and tested on each of the four algorithms. Classifiers trained on MiPOD, S-UNIWARD and WOW data achieve decent error rates when testing on all four algorithms. Most notably, an Ensemble Classifier with an adjusted decision threshold trained on LSB matching data achieves decent detection results on MiPOD, S-UNIWARD and WOW data.

Score-based likelihood ratios in device identification

Many areas of forensics are moving away from the notion of classifying evidence simply as a match or non-match. Instead, some use score-based likelihood ratios (SLR) to quantify the similarity between two pieces of evidence, such as a fingerprint obtained from a crime scene and a fingerprint obtained from a suspect. We apply trace-anchored score-based likelihood ratios to the camera device identification problem. We use photo-response non-uniformity (PRNU) as a camera fingerprint and one minus the normalized correlation as a similarity score. We calculate trace-anchored SLRs for 10,000 images from seven camera devices from the BOSSbase image dataset. We include a comparison between our results the universal detector method.

Automatic Classification of Bloodstain Patterns Caused by Gunshot and Blunt Impact at Various Distances

The forensics discipline of bloodstain pattern analysis plays an important role in crime scene analysis and reconstruction. One reconstruction question is whether the blood has been spattered via gunshot or blunt impact such as beating or stabbing. This paper proposes an automated framework to classify bloodstain spatter patterns generated under controlled conditions into either gunshot or blunt impact classes. Classification is performed using machine learning. The study is performed with 94 blood spatter patterns which are available as public data sets, designs a set of features with possible relevance to classification, and uses the random forests method to rank the most useful features and perform classification. The study shows that classification accuracy decreases with the increasing distance between the target surface collecting the stains and the blood source. Based on the data set used in this study, the model achieves 99% accuracy in classifying spatter patterns at distances of 30 cm, 93% accuracy at distances of 60 cm, and 86% accuracy at distances of 120 cm. Results with 10 additional backspatter patterns also show that the presence of muzzle gases can reduce classification accuracy.

Letter to the Editor: Automatic Classification of Bloodstain Patterns

The forensics discipline of bloodstain pattern analysis plays an important role in crime scene analysis and reconstruction. One reconstruction question is whether the blood has been spattered via gunshot or blunt impact such as beating or stabbing. This paper proposes an automated framework to classify bloodstain spatter patterns generated under controlled conditions into either gunshot or blunt impact classes. Classification is performed using machine learning. The study is performed with 94 blood spatter patterns which are available as public data sets, designs a set of features with possible relevance to classification, and uses the random forests method to rank the most useful features and perform classification. The study shows that classification accuracy decreases with the increasing distance between the target surface collecting the stains and the blood source. Based on the data set used in this study, the model achieves 99% accuracy in classifying spatter patterns at distances of 30 cm, 93% accuracy at distances of 60 cm, and 86% accuracy at distances of 120 cm. Results with 10 additional backspatter patterns also show that the presence of muzzle gases can reduce classification accuracy.

Insights: A Robust Approach to Automatically Locating Grooves in 3D Bullet Land Scans

INSIGHTS

A Robust Approach to Automatically Locating Grooves in 3D Bullet Land Scans

OVERVIEW

Land engraved areas (LEAs) can be important distinguishing factors when analyzing 3D scans from bullets. Creating a 3D image of an LEA requires examiners to also scan portions of the neighboring groove engraved areas (GEAs). Current modeling techniques often struggle to separate LEAs from GEAs. CSAFE researchers developed a new method to automatically remove GEA data and tested this method’s performance against previously proposed techniques.

Lead Researchers

Kiegan Rice
Ulrike Genschel
Heike Hofmann

Journal

Journal of Forensic Sciences

Publication Date

13 December 2019

Publication Number

IN 103 FT

GOAL

1

Present and discuss automated methods for identifying “shoulder locations” between LEAs and GEAs.

The Study

  • Rice et al. gathered 3D scans of 104 bullets from two available data sets (Hamby 44 and Houston), resulting in a total of 622 LEA scans.
  • They removed the curvature from these 3D scans to make 2D crosscuts of each LEA.
  • Using the 2D crosscuts, the team estimated the shoulder locations between LEAs and GEAs using three different models:

Rollapply:

A function (in this case, one available through the open-source “bulletxtrctr” package) which applies a rolling average to smooth out outliers in data.

Robust Linear Model:

A quadratic linear model that minimizes absolute deviations and is therefore less influenced by outliers.

Robust Locally Weighted Regression (LOESS):

A weighted average of many parametric models to fit subsets of data.

Results

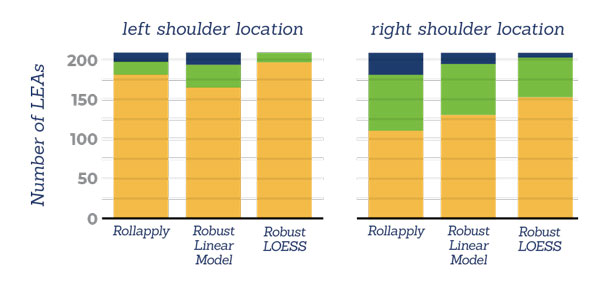
Hamby set 44

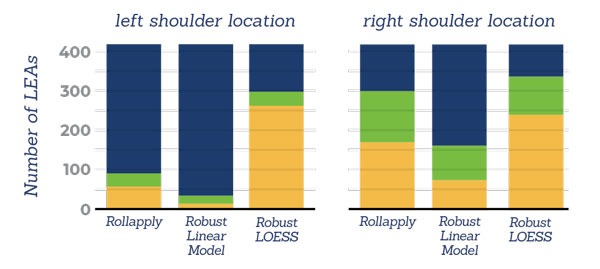
Houston test set

areas of misidentification:

In this graphic, an Area of Misidentification less than 100 is considered a small deviation, between 100 and 1000 is medium, and greater than 1000 is a large deviation.

  • The Robust LOESS model significantly outperformed the Rollapply and Robust Linear models, resulting primarily in small deviations across all test sets.
  • Conversely, the Robust Linear model had the weakest performance of all three, with mostly large deviations across both Houston sets, and only outperforming the Rollapply model in the right shoulder section of the Hamby 44 set.
  • These results were expected, as the Robust LOESS model is intended to be flexible and handle areas that a quadratic linear model would fail to address.

FOCUS ON THE FUTURE


Both the Hamby 44 and Houston datasets used firearms from the same manufacturer. Future studies can expand on these findings by using a wider variety of barrel types, including different caliber sizes, manufacturers and nontraditional rifling techniques.

Insights: Quantifying the Association Between Discrete Event Time Series with Applications to Digital Forensics

INSIGHT

Quantifying the Association Between Discrete Event Time Series with Applications to Digital Forensics

Effects of Proficiency and Cross-examination

OVERVIEW

Digital devices provide a new opportunity to examiners because for every user event — like opening software, browsing online, or sending an email — an event time series is created, logging that data. Yet, using this type of user-generated event data can be difficult to correlate between
two devices for examiners. The research team set out to quantify the degree of association between two event time series both with and without population data.

Lead Researchers

Christopher Galbraith
Padhraic Smyth
Hal S. Stern

Journal

Journal of the Royal Statistical Society

Publication Date

January 2020

Publication Number

IN 102 DIG

The Goals

1

Investigate suitable measures to quantify the association between two event series on digital devices.

2

Determine the likelihood that the series were generated by the same source or by different sources –– ultimately to assess the degree of association between the two event series.

APPROACH AND METHODOLOGY

Researchers explored a variety of measures for quantifying the association between two discrete event time series. They used multiple score functions to determine the similarity between the series. These score functions were discriminative for same- and different-source pairs of event series.

The following methods for assessing the strength of association for a given pair of event series proved most accurate:

1

Constructing score-based likelihood ratios (SLRs) that assess the relative likelihood of observing a given degree of association when the series came from the same or different sources. This uses a population-based approach.

2

Calculating coincidental match probabilities (CMPs) to simulate a different-source score distribution via what the research team refers to as sessionized resampling when working with a single pair of event series. When a sample from a relevant population is not available, this method still produces accurate results.

KEY TAKEAWAYS for Practitioners

1

The population-based approach of SLRs remains the preferred technique in terms of accuracy and interpretability.

2

The resampling technique using CMPs shows significant potential for quantifying the association between a pair of time event series, helping examiners determine the likelihood that two different time series were created by the same person, especially when no population sampling data is available.

3

With multiple-event series, combining these techniques could be valuable for pattern mining to determine which event series are associated with one another.

4

Developments in this area have the capacity to positively impact work in forensic and cybersecurity settings.

Next Steps


Both SLR and CMP techniques require more extensive study and testing before being used in practice by forensic examiners.

All techniques that are described are implemented in the open-source R package assocr.

A Robust Approach to Automatically Locating Grooves in 3D Bullet Land Scans

Land engraved areas (LEAs) provide evidence to address the same source–different source problem in forensic firearms examination. Collecting 3D images of bullet LEAs requires capturing portions of the neighboring groove engraved areas (GEAs). Analyzing LEA and GEA data separately is imperative to accuracy in automated comparison methods such as the one developed by Hare et al. (Ann Appl Stat 2017;11, 2332). Existing standard statistical modeling techniques often fail to adequately separate LEA and GEA data due to the atypical structure of 3D bullet data. We developed a method for automated removal of GEA data based on robust locally weighted regression (LOESS). This automated method was tested on high‐resolution 3D scans of LEAs from two bullet test sets with a total of 622 LEA scans. Our robust LOESS method outperforms a previously proposed “rollapply” method. We conclude that our method is a major improvement upon rollapply, but that further validation needs to be conducted before the method can be applied in a fully automated fashion.

Processing Stamp Bags for Latent Prints: Impacts of Rubric Selection and Gray-Scaling on Experimental Results

We report data on two open issues in our previous experimentation seeking an effective method for development of latent prints on glassine drug bags: (1) the choice of rubric to assess the quality of fingerprints and (2) the choice of whether to use color or gray-scale images. Two research projects were performed to evaluate the impact of the rubric choice and the color adjustments applied. The Dove rubric is preferable to the modified rubric previously used. Analysts report a more uniform application and a more thorough analysis resulting in an upward trend in scores. Although gray-scaling in experimentation is necessary to conceal which treatment was employed, native color images are preferable for casework. The results of this research quantitatively show the impact of native color as measured by the Dove rubric.