OSAC’s New Process Map Focuses on Firearms Examinations

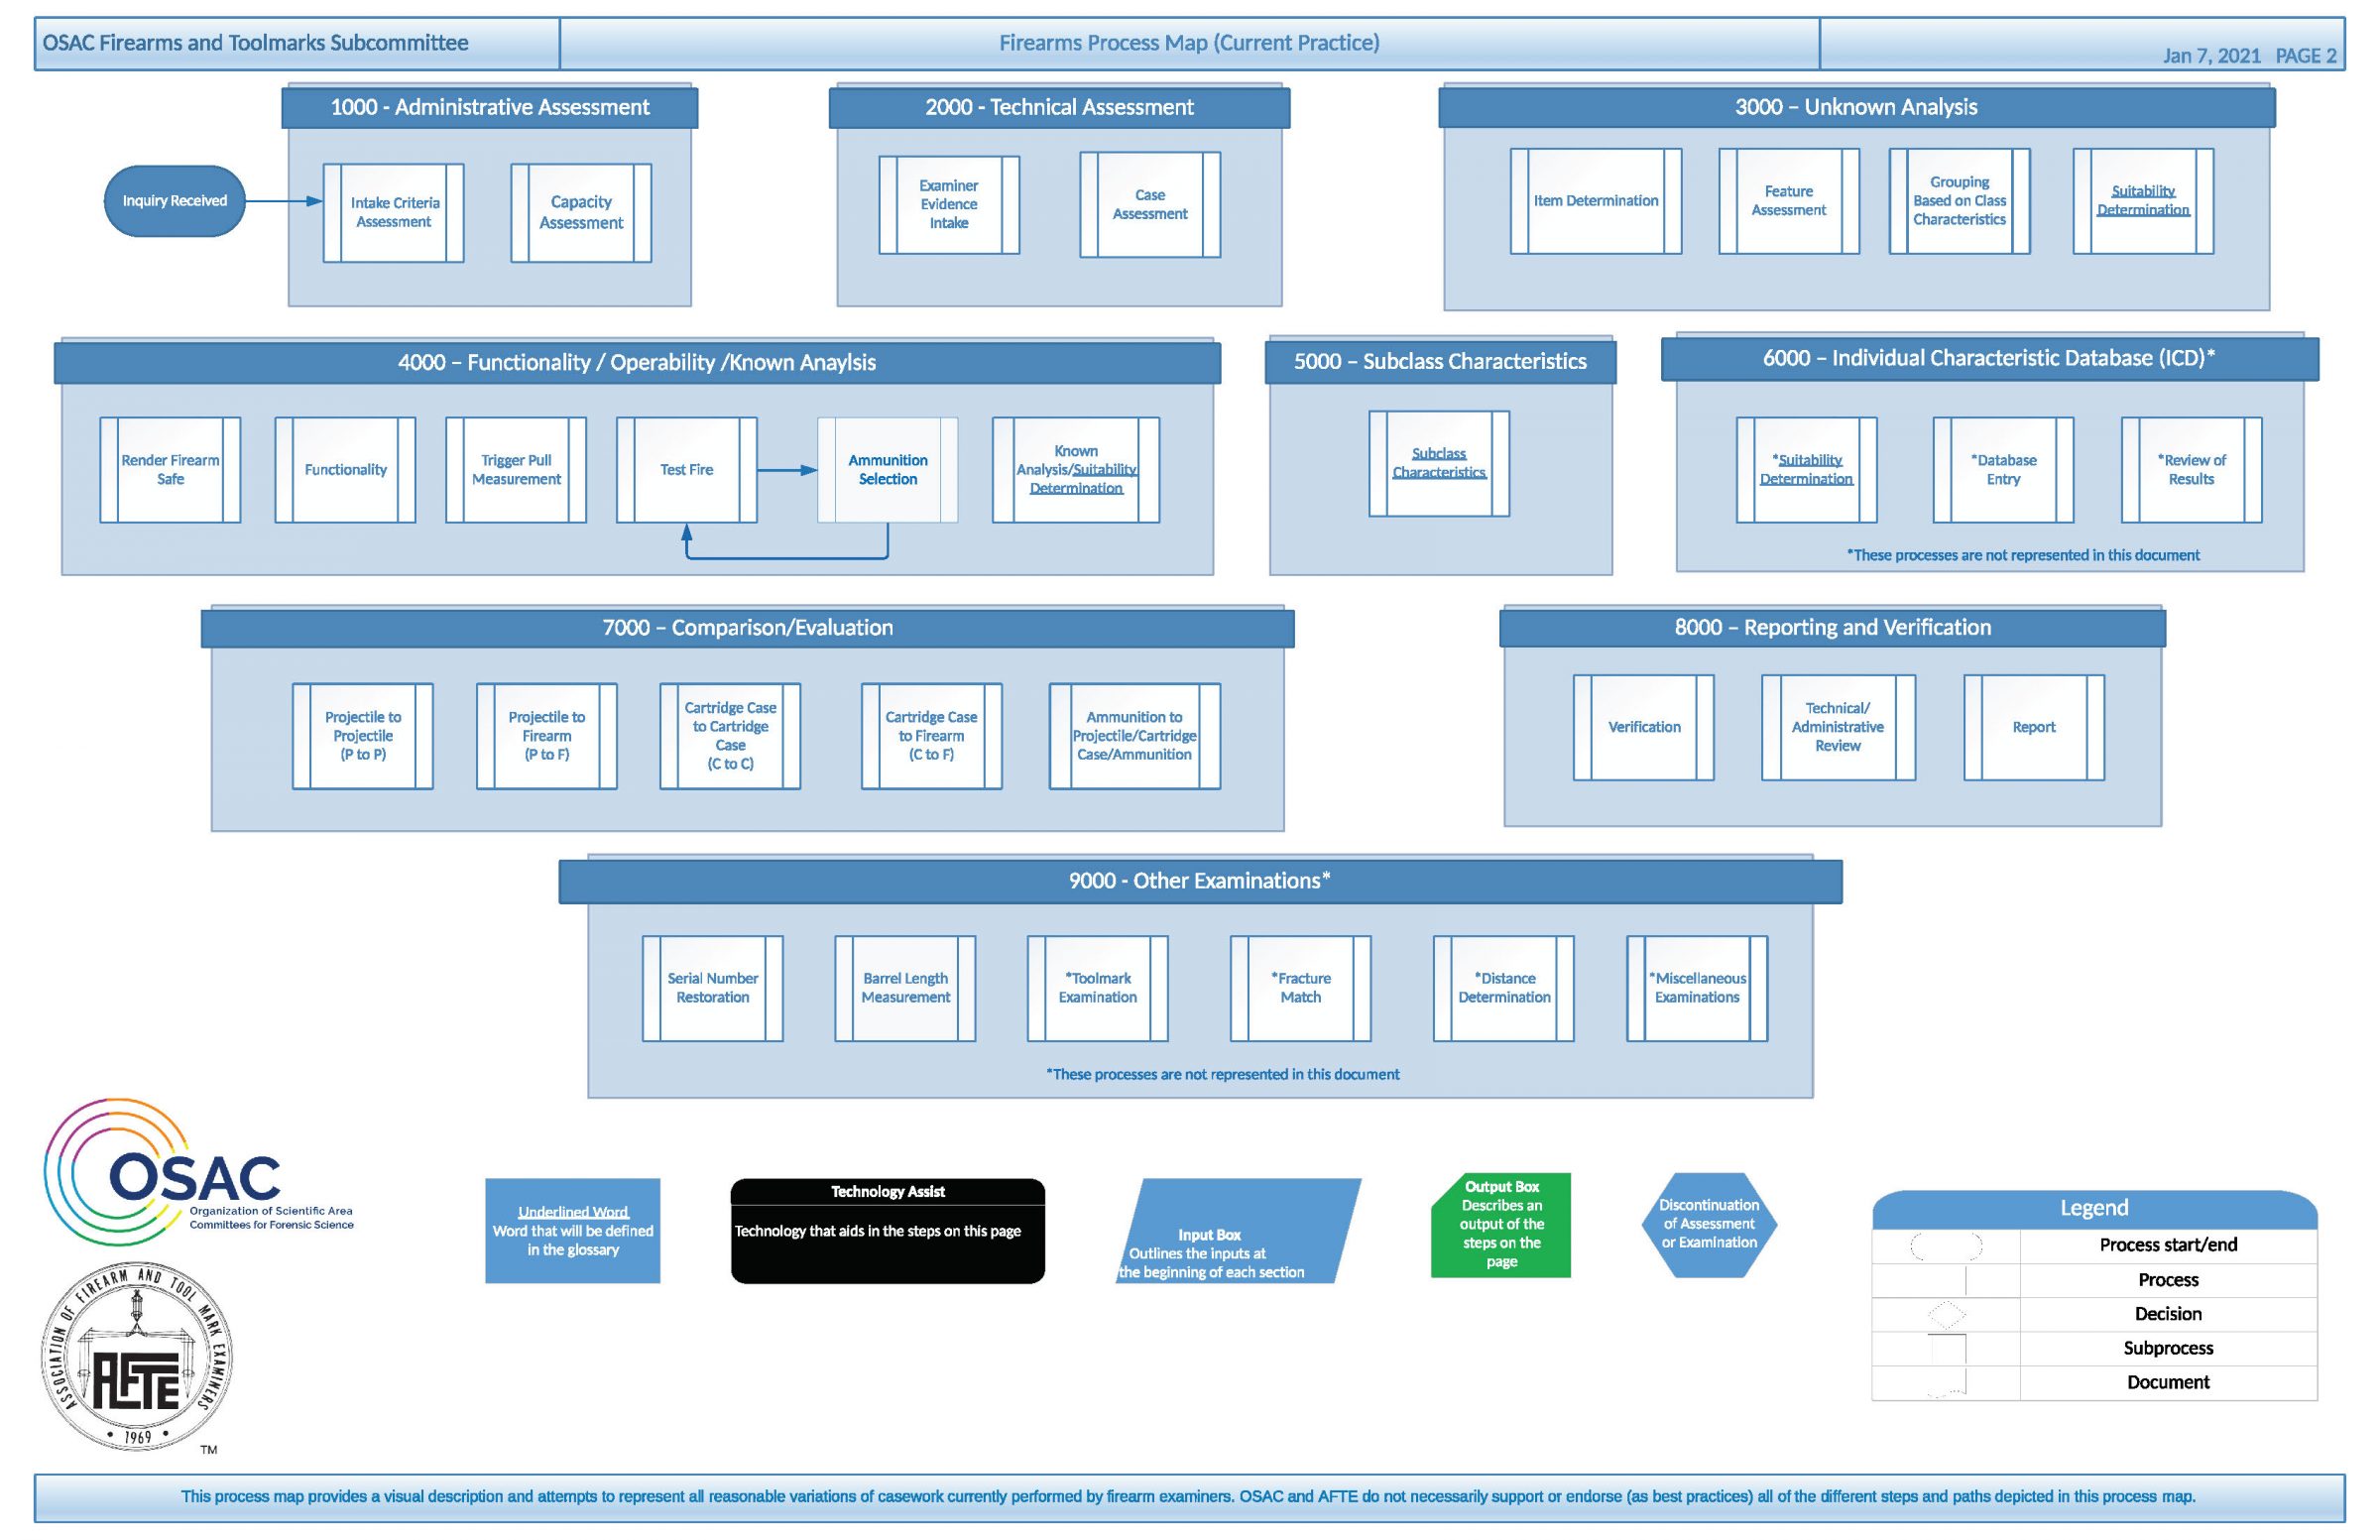
Overview of the Firearms Process Map.

The Organization of Scientific Area Committees (OSAC) for Forensic Science, in partnership with the Association of Firearm and Tool Mark Examiners (AFTE), has just released a process map that describes the process that most firearms examiners use when analyzing evidence. The Firearms Process Map provides details about the procedures, methods and decision points most frequently encountered in firearms examination.

From the OSAC press release:

“This map can benefit the firearm discipline by providing a behind-the-scenes perspective into the various components and complexities involved in the firearms examination process. It can also be used to identify best practices, reduce errors, assist in training new examiners and highlight areas where further research or standardization would be beneficial.”

The Firearms Process Map was developed by the National Institute of Standards and Technology (NIST) Forensic Science Research Program through a collaboration with OSAC’s Firearms & Toolmarks Subcommittee and the Association of Firearm and Tool Mark Examiners (AFTE).

Additional process maps are available from OSAC, including a Friction Ridge Process Map and Speaker Recognition Process Map.

Read the OSAC press release.

Statistical Methods for the Forensic Analysis of User-Event Data

A common question in forensic analysis is whether two observed data sets originate from the same source or from different sources. Statistical approaches to addressing this question have been widely adopted within the forensics community, particularly for DNA evidence, providing forensic investigators with tools that allow them to make robust inferences from limited and noisy data. For other types of evidence, such as fingerprints, shoeprints, bullet casing impressions and glass fragments, the development of quantitative methodologies is more challenging. In particular, there are significant challenges in developing realistic statistical models, both for capturing the process by which the evidential data is produced and for modeling the inherent variability of such data from a relevant population.

In this context, the increased prevalence of digital evidence presents both opportunities and challenges from a statistical perspective. Digital evidence is typically defined as evidence obtained from a digital device, such as a mobile phone or computer. As the use of digital devices has increased, so too has the amount of user-generated event data collected by these devices. However, current research in digital forensics often focuses on addressing issues related to information extraction and reconstruction from devices and not on quantifying the strength of evidence as it relates to questions of source.

This dissertation begins with a survey of techniques for quantifying the strength of evidence (the likelihood ratio, score-based likelihood ratio and coincidental match probability) and evaluating their performance. The evidence evaluation techniques are then adapted to digital evidence. First, the application of statistical approaches to same-source forensic questions for spatial event data, such as determining the likelihood that two sets of observed GPS locations were generated by the same individual, is investigated. The methods are applied to two geolocated event data sets obtained from social networks. Next, techniques are developed for quantifying the degree of association between pairs of discrete event time series, including a novel resampling technique when population data is not available. The methods are applied to simulated data and two real-world data sets consisting of logs of computer activity and achieve accurate results across all data sets. The dissertation concludes with suggestions for future work.

Psychometric analysis of forensic examiner behavior

Forensic science often involves the comparison of crime-scene evidence to a known-source sample to determine if the evidence and the reference sample came from the same source. Even as forensic analysis tools become increasingly objective and automated, final source identifications are often left to individual examiners’ interpretation of the evidence. Each source identification relies on judgements about the features and quality of the crime-scene evidence that may vary from one examiner to the next. The current approach to characterizing uncertainty in examiners’ decision-making has largely centered around the calculation of error rates aggregated across examiners and identification tasks, without taking into account these variations in behavior. We propose a new approach using IRT and IRT-like models to account for differences among examiners and additionally account for the varying difficulty among source identification tasks. In particular, we survey some recent advances (Luby 2019a) in the application of Bayesian psychometric models, including simple Rasch models as well as more elaborate decision tree models, to fingerprint examiner behavior.

Juror appraisals of forensic evidence: Effects of blind proficiency and cross-examination

Forensic testimony plays a crucial role in many criminal cases, with requests to crime laboratories steadily increasing. As part of efforts to improve the reliability of forensic evidence, scientific and policy groups increasingly recommend routine and blind proficiency tests of practitioners. What is not known is how doing so affects how lay jurors assess testimony by forensic practitioners in court. In Study 1, we recruited 1398 lay participants, recruited online using Qualtrics to create a sample representative of the U.S. population with respect to age, gender, income, race/ethnicity, and geographic region. Each read a mock criminal trial transcript in which a forensic examiner presented the central evidence. The low-proficiency forensic examiner elicited a lower conviction rate and less favorable impressions than the control, an examiner for which no proficiency information was disclosed. However, the high-proficiency examiner did not correspondingly elicit a higher conviction rate or more favorable impressions than the control. In Study 2, 1420 participants, similarly recruited using Qualtrics, received the same testimony, but for some conditions the examiner was cross-examined by a defense attorney. We find cross-examination significantly reduced guilty votes and examiner ratings for low-proficiency examiners. These results suggest that disclosing results of blind proficiency testing can inform jury decision-making, and further, that defense lawyering can make proficiency information particularly salient at a criminal trial.

Statistical Methods for the Forensic Analysis of Geolocated Event Data

A common question in forensic analysis is whether two observed data sets originated from the same source or from different sources. Statistical approaches to addressing this question have been widely adopted within the forensics community, particularly for DNA evidence. Here we investigate the application of statistical approaches to same-source forensic questions for spatial event data, such as determining the likelihood that two sets of observed GPS locations were generated by the same individual. We develop two approaches to quantify the strength of evidence in this setting. The first is a likelihood ratio approach based on modeling the spatial event data directly. The second approach is to instead measure the similarity of the two observed data sets via a score function and then assess the strength of the observed score resulting in the score-based likelihood ratio. A comparative evaluation using geolocated Twitter event data from two large metropolitan areas shows the potential efficacy of such techniques.

Implementing blind proficiency testing in forensic laboratories: Motivation, obstacles, and recommendations

Regular proficiency testing of forensic examiners is required at accredited laboratories and widely accepted as an important component of a functioning quality assurance program. Yet, unlike in other testing industries, the majority of forensic laboratories testing programs rely entirely on declared proficiency tests. Some laboratories, primarily federal forensic facilities, have adopted blind proficiency tests, which are also used in the medical and drug testing industries. Blind tests offer advantages. They must resemble actual cases, can test the entire laboratory pipeline, avoid changes in behavior from an examiner knowing they are being tested, and are one of the only methods that can detect misconduct. However, the forensic context present both logistical and cultural obstacles to the implementation of blind proficiency tests. In November 2018, we convened a meeting of directors and quality assurance managers of local and state laboratories to discuss obstacles to the adoption of blind testing and assess successful and potential strategies to overcome them. Here, we compare the situation in forensic science to other testing disciplines, identifying obstacles to the implementation of blind proficiency testing in forensic contexts, and proposing ways to address those issues and increase the ecological validity of proficiency tests at forensic laboratories.

Statistical models to predict exposure settings using two different iPhone camera apps

The StegoAppDB [Newman, J. (2019)] is a digital image database containing camera data from Android and iPhone mobile phones and developed for forensic purposes. Taken with a custom-designed camera app called Cameraw rather than the camera app native to the mobile device, it is not known what relation exists between the exposure settings of images taken with Cameraw and those with the native app. This knowledge would provide the digital image forensic analyst more information to answer this question: are the images in the database representative of images encountered in forensic settings? To this end, this thesis provides results from experiments designed to model the relation between exposure settings between images taken from the two camera apps.For purposes of this thesis, the term exposure settings denotes the exposure time and the ISO value excluding the lens aperture variable, as that last variable is fixed on a mobile phone.In this thesis, images acquired from four iOS devices – an iPhone 7, iPhone 8, and two iPhone Xs – are analyzed to develop regression models that fit exposure settings from image data for each device. Specific image acquisition experiments are designed to collect pairs of images very close in time and space from each of the two apps so that their exposure settings could be compared. A broad range of ISO and exposure time values are collected to represent a variety of exposure settings possible on a mobile device. Several different regression models with cross validation are developed for the data from each phone, and generalized linear models are also applied. Errors for the training, validation and testing sets are used to evaluate the performance of individual models, and the adjusted R-squared statistic is used to compare performances across models. The best models with respect to the performance measures are identified for each type of analysis and for each iPhone.The results show that most of the linear models typically model the data fairly well, and exposure settings can be predicted from the models. One notable exception is the iPhone 7: the best models for the iPhone 7 are different because the exposure setting data differs significantly from the other two iPhone models’ exposure setting data. The results in this thesis show that in a very limited case, for these four devices, the Cameraw app can be a reliable alternative to the native camera app.

Statistical methods for digital image forensics: Algorithm mismatch for blind spatial steganalysis and score-based likelihood ratios for camera device identification

Forensic science currently faces a variety of challenges. Statistically suitable reference databases need to be developed and maintained. Subjective methods that can introduce bias need to be replaced by objective methods. Highly technical forensic methods need to be clearly and accurately communicated to juries. Juries should also be given information about the strength of the forensic evidence.

Many traditional blind steganalysis frameworks require training examples from all potential steganographic embedding algorithms, but creating a representative stego image database becomes increasingly more difficult as the number and availability of embedding algorithm grows. We introduce a straight-forward, non-data-intensive framework for blind steganalysis that only requires examples of cover images and a single embedding algorithm for training. Our framework addresses the case of algorithm mismatch, where a classifier is trained on one algorithm and tested on another. Our experiments use RAW image data from the BOSSbase Database and six iPhone devices from the StegoAppDB project. We use four spatial embedding algorithms: LSB matching, MiPOD, S-UNIWARD, and WOW. We train Ensemble Classifiers with Spatial Rich Model features on a single embedding algorithm and tested on each of the four algorithms. Classifiers trained on the MiPOD, S-UNIWARD and WOW embedding algorithms achieve decent detection rates when testing on all four spatial embedding algorithms. Most notably, an Ensemble Classifier with an adjusted decision threshold trained on LSB matching data achieves decent detection rates on the three more advanced, content-adaptive algorithms: MiPOD, S-UNIWARD and WOW.

Score-based likelihood ratios (SLR) have been employed in various areas of forensics when likelihood ratios (LR) are unavailable. SLRs, like LRs, quantify the strength of evidence in support of two mutually exclusive but non-exhaustive hypotheses. LRs and SLRs have both been used for camera device identification, but the full framework for source-anchored, trace-anchored, and general match SLRs has not been investigated. In this work, we present a framework for all three types of SLRs for camera device identification. We use photo-response non-uniformity (PRNU) estimates as camera fingerprints and correlation distance as a similarity score. We calculate source-anchored, trace-anchored, and general match SLRs for 48 camera devices from four publicly available image databases: ALASKA, BOSSbase, Dresden, and StegoAppDB. Our experiments establish that all three types of SLRs are capable of distinguishing between devices of the same model and between devices from different models. The false positive and false negative rates for all three types of SLRs are low, and can be lowered further still by adding an inconclusive class.

Bayesian hierarchical modeling for the forensic evaluation of handwritten documents

The analysis of handwritten evidence has been used widely in courts in the United States since the 1930s (Osborn, 1946). Traditional evaluations are conducted by trained forensic examiners. More recently, there has been a movement toward objective and probability-based evaluation of evidence, and a variety of governing bodies have made explicit calls for research to support the scientific underpinnings of the field (National Research Council, 2009; President’s Council of Advisors on Science and Technology (US), 2016; National Institutes of Standards and Technology). This body of work makes contributions to help satisfy those needs for the evaluation of handwritten documents.

We develop a framework to evaluate a questioned writing sample against a finite set of genuine writing samples from known sources. Our approach is fully automated, reducing the opportunity for cognitive biases to enter the analysis pipeline through regular examiner intervention. Our methods are able to handle all writing styles together, and result in estimated probabilities of writership based on parametric modeling. We contribute open-source datasets, code, and algorithms.

A document is prepared for the evaluation processed by first being scanned and stored as an image file. The image is processed and the text within is decomposed into a sequence of disjoint graphical structures. The graphs serve as the smallest unit of writing we will consider, and features extracted from them are used as data for modeling. Chapter 2 describes the image processing steps and introduces a distance measure for the graphs. The distance measure is used in a K-means clustering algorithm (Forgy, 1965; Lloyd, 1982; Gan and Ng, 2017), which results in a clustering template with 40 exemplar structures. The primary feature we extract from each graph is a cluster assignment. We do so by comparing each graph to the template and making assignments based on the exemplar to which each graph is most similar in structure. The cluster assignment feature is used for a writer identification exercise using a Bayesian hierarchical model on a small set of 27 writers. In Chapter 3 we incorporate new data sources and a larger number of writers in the clustering algorithm to produce an updated template. A mixture component is added to the hierarchical model and we explore the relationship between a writer’s estimated mixing parameter and their writing style. In Chapter 4 we expand the hierarchical model to include other graph-based features, in addition to cluster assignments. We incorporate an angular feature with support on the polar coordinate system into the hierarchical modeling framework using a circular probability density function. The new model is applied and tested in three applications.