
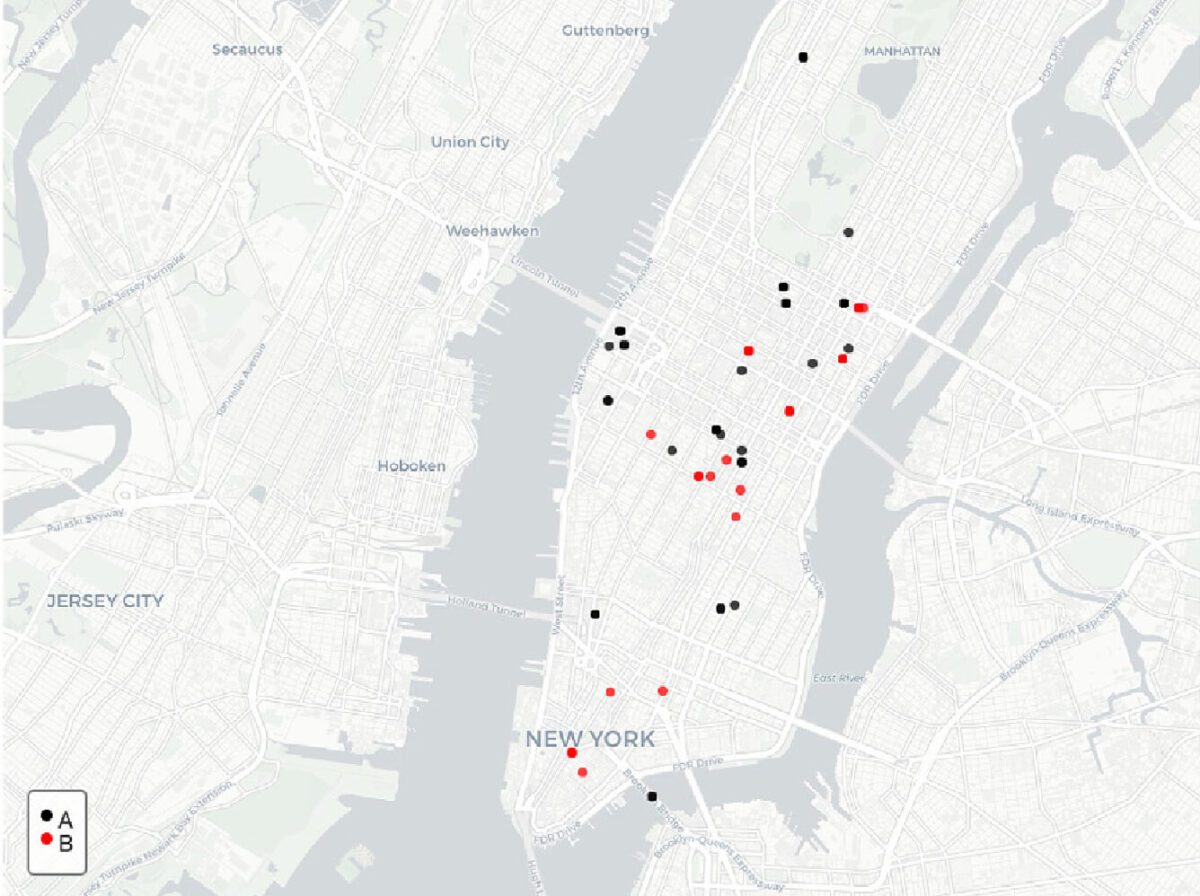
Figure 2 from the study: An example of sets of locations for Twitter data from New York. The patterns correspond to geolocatons of tweets from the same account over two different months, with month 1 corresponding to A (red) and month 2 corresponding to B (black).
Posted March 31, 2021
“There is a growing need for the development of quantitative statistical methods in digital forensics,” said Chris Galbraith, lead author of the study and former Ph.D. student in statistics at the University of California, Irvine, who is now at Obsidian Security. “Existing forensic tools for digital evidence rely on extracting data from devices followed by exploratory analysis with little current support for statistical quantification.”
Galbraith and his colleagues sought to develop quantitative techniques to analyze geolocated data that is now available on modern mobile devices. Geolocated data is typically associated with events generated on a device, such as actions taken by a user in a software application, Galbraith explained.
“Given the prevalence of mobile devices, this type of spatial event data is now encountered with increasing regularity in forensic investigations,” said Galbraith.
The study, published in Forensic Science International: Digital Investigation, investigated the application of statistical approaches for forensic analysis of geolocated event data. For example, a forensic investigator may need to assess whether two sets of GPS locations corresponding to different accounts or devices were generated by the same source.
Galbraith and his colleagues developed two approaches to examine geolocated event data. The first was the likelihood ratio approach using kernel density estimation techniques to estimate the relative likelihood of the location evidence under the premise that two sets of locations were generated by a single source or from different sources.
The second approach developed a score to summarize the similarity of the two sets of locations and assessed the strength of the evidence resulting in the score-based likelihood ratio.
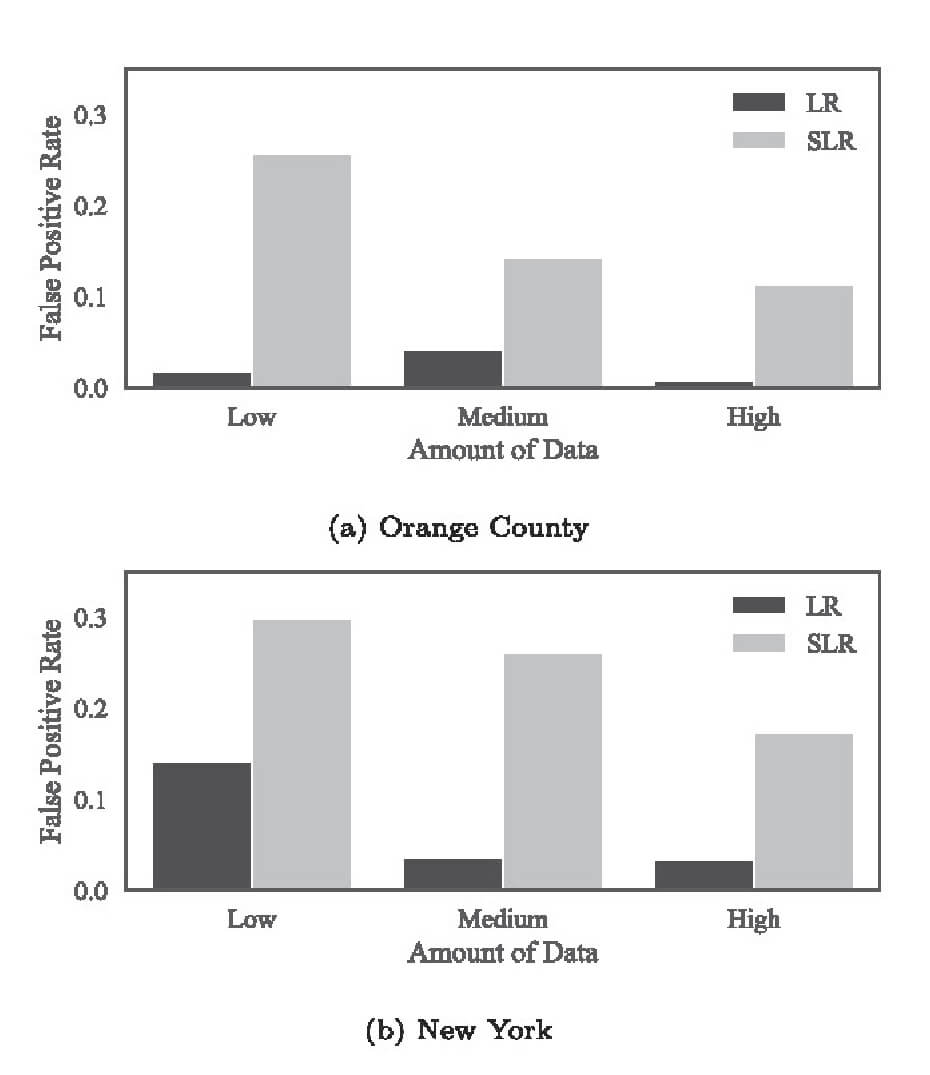
The research team used geolocation datasets of Twitter messages to evaluate their approaches. Galbraith said the popular social media app provided a useful publicly accessible source of user-event data that showed the geolocation of each message generated by an account.
The data was collected over two spatial regions, Orange County, CA, and the Manhattan borough of New York City, from May 2015 to Feb. 2016. Selecting only tweets with GPS data from public accounts, they were able to gather event data regarding the population density and the frequency of geolocated events in each area.
After filtering the data, the researchers applied their approaches to determine the effectiveness in quantifying the strength of evidence for sets of locations.
Based on the datasets they investigated, Galbraith said they found that both methods showed promise in being able to distinguish same-source pairs of spatial event data from different-source pairs. Although, they found that the likelihood ratio approach outperformed the score-based likelihood ratio approach.
“We believe these statistical approaches could be useful in ranking the similarity of multiple different sets of locations from known sources to a single set of locations from an unknown source,” said Galbraith.
Padhraic Smyth, Chancellor’s Professor of computer science, and Hal S. Stern, CSAFE co-director and Provost and Executive Vice Chancellor and Chancellor’s Professor of statistics, both from the University of California, Irvine, contributed to the study.
View and download the journal article at https://lib.dr.iastate.edu/csafe_pubs/75/.
View insights from this study: Statistical Methods for the Forensic Analysis of Geolocated Event Data.
Learn more about CSAFE’s research on digital evidence at https://forensicstats.org/digital-evidence/.
From the Blog
Two Journals for Sharing Your Forensic Science and Statistics Research
If you’re looking for a journal to showcase your latest research findings, consider exploring these …

NIST Report Highlights Key Challenges in Forensic Science and Provides Strategies for Addressing Them
In September, the National Institute of Standards and Technology (NIST) released a new report titled …

Recent Posts
Keynote Speakers Announced for ICFIS 2026
August 10, 2026
The Scientific Committee for the 12th International Conference on Forensic Inference and Statistics is pleased to announce the keynote speakers …
CSAFE Researchers will be Panel Speakers at NAFSB 2026 Conference
August 7, 2026
The annual National Association of Forensic Science Boards (NAFSB) Conference will be Oct. 13-16 at the Milwaukee Crime Lab Bureau …
ICFIS 2026 Moves Online, Abstract Deadline Extended to Aug. 17
July 27, 2026
The 12th International Conference on Forensic Inference and Statistics (ICFIS) will now be an online-only event, allowing participants from around the world …