

Lead Researchers
Stephanie Reinders, PhD
Yong Guan, PhD
Danica Ommen, PhD
Jennifer Newman, PhD
Journal
Journal of Forensic Sciences
Publication Date
6 February 2022
Publication Number
IN 126 STAT
Overview
In the developing field of digital image forensics, it is important to be able to identify cameras and other digital devices involved in crimes. However, current camera identification methods fail to quantify the strength of evidence, making it challenging for such evidence to withstand scrutiny in courts. Researchers funded by CSAFE propose using Score-Based Likelihood Ratios to quantify the weight of evidence in digital camera identification.
Goals
1
Create Score-Based Likelihood Ratios (SLRs) to evaluate the strength of camera identification evidence
2
Compare different SLR models to determine which is the most accurate
The Study
All cameras have small manufacturing imperfections that cause slight variations among pixels in the camera sensor array. These imperfections are known as Photo-Response Non-Uniformities (PRNUs), which create a sort of “camera fingerprint” on images taken with that camera. These PRNUs can be used to identify the device used for a questioned image.
Reinders et al. used a dataset of 4,800 images from a total of 48 known camera devices. They then calculated a similarity score (notated as Δ) between questioned images (Q) and the PRNUs (K) of each camera.
From this, they constructed three different SLRs, each meant to determine the likelihood that a questioned image Q and Person of Interest’s camera’s PRNU K came from the same camera (hypothesis Hp), compared to the likelihood that Q and K came from different cameras (hypothesis Hd).
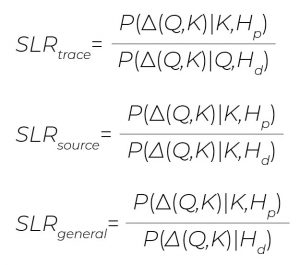
The three constructed SLR equations
Key Definitions
Trace-Anchored SLR
Considers similarity scores between a questioned sample of evidence and samples from the alternative population
Source-Anchored SLR
Considers similarity scores between samples from a specific known source and samples from the alternative population
General Match SLR
Considers similarity scores between samples from randomly selected sources
Key Takeaways For Practitioners
Of the three questioned methods, the Trace-Anchored SLR had the lowest rate of misleading evidence favoring either the prosecution or the defense with a false positive rate of 2.7% and a false negative rate of 0.5%.
In addition, the Trace-Anchored SLR showed “strong” support for a match in 87.7% of cases where the questioned image came from the Person of Interest’s camera.
By comparison, the General-Match SLR performed the poorest, with false positive rate of 4.7% and a false negative rate of 1.5%. Additionally, the General Match SLR showed “weak” support for a match in 68.6% of cases where the questioned image came from the Person of Interest’s camera.
The Source-Anchored SLR fell in the middle, with a false positive rate of 4.1% and a false negative rate of 0.8%.
Focus on the future

The data used in this study was a closed set, where all images came from the same known 26 devices, and were RAW, center-cropped, auto-exposure, and landscape orientation. Future studies may include an open set, with a larger variety of devices and image types, which may yield different results.
Several researchers have employed an “Inconclusive Zone” that does not result in a definitive match or non-match. This could be included in future studies, and if used in courts, could put further burden of proof on the prosecution and greater benefit of the doubt for the defense.