Statistical Methods for the
Forensic Analysis of Geolocated
Event Data
OVERVIEW
Researchers investigated the application of statistical methods to forensic questions involving spatial event-based digital data. A motivating example involves assessing whether or not two sets of GPS locations corresponding to digital events were generated by the same source. The team established two approaches to quantify the strength of evidence concerning this question.
Lead Researchers
Christopher Galbraith Padhraic Smyth Hal S. Stern
Journal
Forensic Science International: Digital Investigation
Publication Date
July 2020
Publication Number
IN 108 DIG
The Goal
Develop quantitative techniques for the forensic analysis of geolocated event data.
APPROACH AND METHODOLOGY
Researchers collected geolocation data from Twitter messages over two spatial regions, Orange County, CA and the borough of Manhattan in New York City, from May 2015 to February 2016. Selecting only tweets from public accounts, they were able to gather GPS data regarding the frequency of geolocated events in each area.
Key Definitions
Likelihood Ratio (LR)
A comparison of the probability of observing a set of evidence measures under two different theories in order to assess relative support for the theories.
Score-Based Likelihood Ratio (SLR)
An approach that summarizes evidence measures by a score function before applying the likelihood ratio approach.
This study considered a scenario in which two sets of tweet locations are relevant to then determine the source of the tweets. The tweets could be from different devices or from the same device during two different time periods.
The team used kernel density estimation to establish a likelihood ratio approach for observing the tweets under two competing hypotheses: are the tweets from the same source or a different source?
Utilizing this second approach creates a score-based likelihood ratio that summarizes the similarity of the two sets of locations while assessing the strength of the evidence.
Decisions based on both LR and SLR approaches were compared to known ground truth to determine true and false-positive rates.
KEY TAKEAWAYS FOR PRACTITIONERS
1
Both methods show promise in being able to distinguish same-source pairs of spatial event data from different-source pairs.
2
The LR approach outperformed the SLR approach for all dataset sizes considered.
3
The behavior of both approaches can be impacted by the characteristics of the observed region and amount of evidential data available.
FOCUS ON THE FUTURE
In this study, time defined sets of locations gathered from Twitter. But, other methods for defining sets of locations, for example, including multiple devices over the same time period, could yield different results.
The amount of available data (the number of tweets) impacts the score-based approach.
Psychometric Analysis of
Forensic Examiner Behavior
OVERVIEW
Understanding how fingerprint examiners’ proficiency and behavior influence their decisions when interpreting evidence requires the use of many analytical models. Researchers sought to better identify and study uncertainty in examiners’ decision making. This is because final source identifications still rely on complex and subjective interpretation of the evidence by examiners. By applying novel methods like Item Response Theory (IRT) to existing tools like error rate studies, the team proposes a new approach to account for differences among examiners and in task difficulty levels.
Lead Researchers
Amanda Luby Anjali Mazumder Brian Junker
Publication Date
June 13, 2020
Journal
Behaviormetrika
Publication Number
IN 107 LP
THE GOALS
1
Survey recent advances in psychometric analysis of forensic decision-making.
2
Use behavioral models from the field of Item Response Theory to better understand the operating characteristics of the identification tasks that examiners perform.
APPROACH AND METHODOLOGY
The Data
A 2011 FBI Black Box study assigned 169 fingerprint examiners a selection of items to analyze, which included a latent print evaluation, a source destination, a reason and a rating of the difficulty of the task for each pair of prints.
Key Definitions
Psychometrics
Using factors such as aptitudes and personality traits to study the difference between individuals.
Item Response Trees (IRTrees)
Visual representation of each decision an examiner makes in the process of performing an identification task. Based on IRT, which attempts to explain the connections between the properties of a test item –– a piece of fingerprint evidence –– and an individual’s –– a fingerprint examiner’s –– performance in response to that item.
Cultural Consensus Theory (CCT)
A method that facilitates the discovery and description of consensus among a group of people with shared beliefs. For this study, CCT helps identify the common knowledge and beliefs among fingerprint examiners –– things that examiners may take for granted but that laypeople would not necessarily know.
APPLYING IRTREES AND CCT TO FINGERPRINT ANALYSIS
1
Researchers segmented the data with the Rasch Model to separate a latent print’s difficulty level from an examiners’ proficiency. This allowed comparison to the existing method of studying error rates.
2
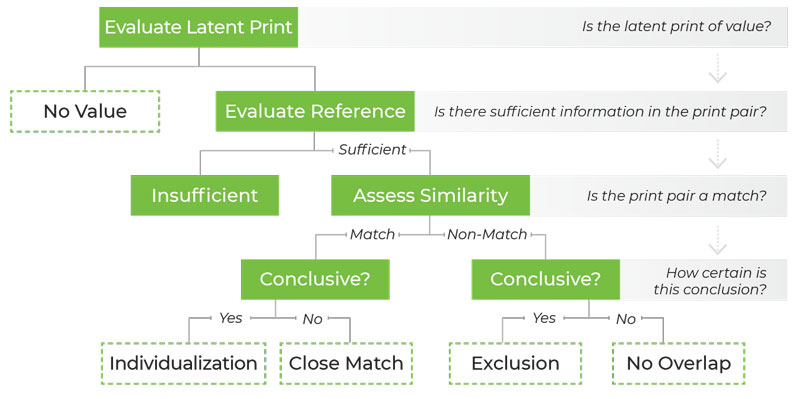
Then they constructed IRTrees to model a fingerprint examiner’s decision-making process when deciding whether a print is a positive match, negative match, inconclusive, or has no latent value. (See Figure 1)
3
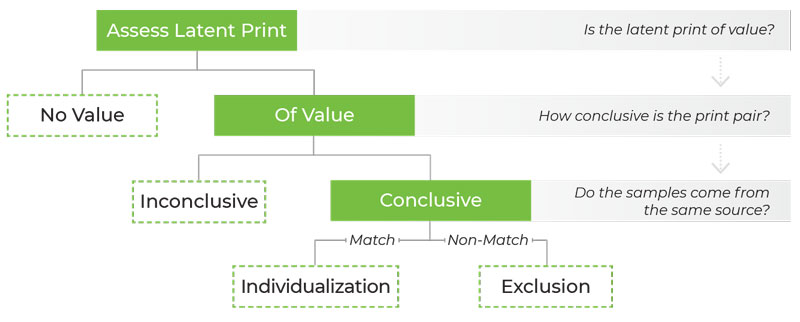
Finally, the team used IRTrees and Cultural Consensus Theory to create “answer keys” –– a set of reasons and shared knowledge –– that provide insight into how a fingerprint examiner arrives at an “inconclusive” or “no value” decision. (See Figure 2)
Figure 1
Visual representation of latent print analysis
Figure 2
How examiners arrive at “inconclusive” or “no value” decisions
KEY TAKEAWAYS FOR PRACTITIONERS
1
Using IRT models provides substantial improvement over current examiner error rate studies. These include the ability to justifiably compare examiner proficiencies even if they did not do the same identification tasks and that the influence of task difficulty can be seen in examiner proficiency estimates.
2
IRTrees give researchers the ability to accurately model the complex decision-making in fingerprint identification tasks –– it is much more than simply stating a print is a “match” or a “non-match.” This reveals the skill involved in fingerprint examination work.
3
Examiners tend to overrate the difficulty of middling-difficulty tasks, while underrating the difficulty of extremely easy or extremely difficult tasks.
FOCUS ON THE FUTURE
This analysis was somewhat limited by available data; for confidentiality and privacy considerations, the FBI Black Box Study does not provide the reference prints used nor the personal details of the examiners themselves. Future collaboration with experts, both in fingerprint analysis and human decision making, can provide more detailed data and thus improve the models.
Error Rates, Likelhood Ratios, and Jury Evaluation of Forensic Evidence
OVERVIEW
Forensic examiner testimony regularly plays a role in criminal cases — yet little is known about the weight of testimony on jurors’ judgment.
Researchers set out to learn more: What impact does testimony that is further qualified by error rates and likelihood ratios have on jurors’ conclusions concerning fingerprint comparison evidence and a novel technique involving voice comparison evidence?
Lead Researchers
Brandon L. Garrett J.D. William E. Crozier, Ph.D. Rebecca Grady, Ph.D.
Journal
Journal of Forensic Sciences
Publication Date
22 April 2020
Publication Number
IN 106 IMPL
THE HYPOTHESIS
Participants would place less weight on voice comparison testimony than they would on fingerprint testimony, due to cultural familiarity and perceptions.
Participants who heard error rate information would put less weight on forensic evidence — voting guilty less often — than participants who heard traditional and generic instructions lacking error rates.
Participants who heard likelihood ratios would place less weight on forensic expert testimony compared to testimony offering an unequivocal and categorical conclusion of an ID or match.
APPROACH AND METHODOLOGY
WHO
900 participants read a mock trial about a convenience store robbery with 1 link between defendant and the crime
WHAT
2 (Evidence: Fingerprint vs. Voice Comparison) x 2 (Identification: Categorical or Likelihood Ratio) x 2 (Instructions: Generic vs. Error Rate) design
HOW
Participants were randomly assigned to 1 of the 8 different conditions
After reading materials + jury instructions, participants decided whether they would vote “beyond-a-reasonable-doubt” that the defendant was guilty
KEY TAKEAWAYS FOR PRACTITIONERS
Laypeople gave more weight to fingerprint evidence than voice comparison evidence.
Fewer guilty verdicts arose from voice evidence — novel forensic evidence methods might not provide powerful evidence of guilt.
Fingerprint evidence reliability decreases when jurors learn about error rates.
Error rate information appears particularly important for types of forensic evidence that people may already assume as highly reliable.
Participants considering fingerprint evidence were more likely to find the defendant not guilty when provided instruction on error rates. When the fingerprint expert offered a likelihood ratio, the error rate instructions did not decrease guilty verdicts.
When asked to rate which is worse — wrongly convicting an innocent person or failing to convict a guilty person or both — the study found the majority of participants were concerned with convicting an innocent person.
30%
Participants who believe convicting an innocent person was the worst offense were less likely to vote guilty due to more doubt in the evidence.
0%
Those who had greater concern for releasing a guilty person were more likely to vote guilty.
0%
of participants believed the errors were equally bad.
Researchers found, overall, that presenting an error rate moderated the weight of evidence only when paired with a fingerprint identification.
FOCUS ON THE FUTURE
To produce better judicial outcomes when juries are formed with laypeople:
Direct efforts toward offering more explicit judicial instructions.
Craft a better explanation of evidence limitations.
Consider the findings when developing new forensic techniques –– new techniques aren’t as trusted by a jury despite proving more reliable and lowering error rates.
Pay attention to juror preconceptions about the reliability of evidence.
Comparison of three similarity
scores for bullet LEA matching
OVERVIEW
As technology advances in the forensic sciences, it is important to evaluate the performance of recent innovations. Researchers funded by CSAFE judged the efficacy of different scoring methods for comparing land engraved areas (LEAs) found on bullets.
Lead Researchers
Susan Vanderplas Melissa Nally Tylor Klep Christina Cadevall Heike Hofmann
Journal
Forensic Science International
Publication Date
March 2020
Publication Number
IN 105 FT
THE GOALS
Evaluate the performance of scoring measures at a land-to-land level, using random forest scoring, cross correlation and consecutive matching striae (CMS).
Consider the efficacy of these scoring measures on a bullet-to-bullet level.
The Study
Data was taken from three separate studies, each using similar firearms from the same manufacturer, Ruger, to compare land engraved areas (LEAs), areas on a bullet marked by a gun barrel’s lands –– the sections in between the grooves on the barrel’s rifling.
Examiners processed the LEA data through a matching algorithm and scored it using these three methods:
1
Random Forest (RF):
A form of machine-learning that utilizes a series of decision trees to reach a single result.
2
Cross-Correlation (CC):
A measure of similarity between two series of data.
3
Consecutive Matching Striae (CMS):
Identifying the similarities between the peaks and valleys of LEAs.
Results
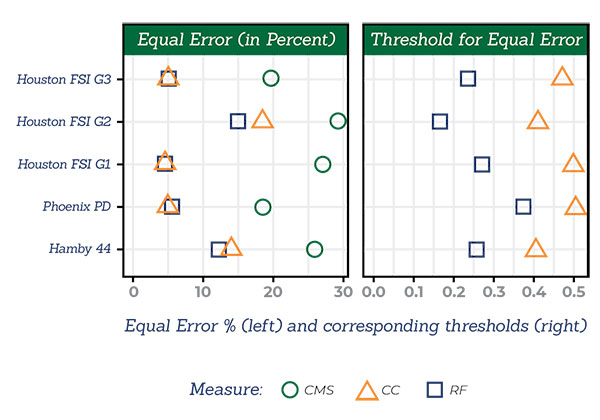
The Equal Error rate of each scoring method across multiple studies
On a bullet-to-bullet level, the Random Forest and Cross-Correlation scoring methods made no errors.
On a land-to-land level, the RF and CC methods outperformed the CMS method.
When comparing equal error rates, the CMS method had an error rate of over 20%, while both the RF and CC methods’ error rates were roughly 5%. The RF method performed slightly better.
FOCUS ON THE FUTURE
The random forest algorithm struggled to identify damage to bullets that obscured LEAs caused by deficiencies in the gun barrel such as pitting from gunpowder or “tank rash” from expended bullets.
In future studies, examiners could pair the RF algorithm with another algorithm to assess the quality of the data and determine which portions can be used for comparison.
All the studies used firearms from Ruger, a manufacturer picked because their firearms mark very well on bullets. Future studies can assess the performance of these scoring methods on firearms from different manufacturers with differing quality marks.
An Algorithm to Compare
Two-Dimensional Footwear Outsole
Images Using Maximum Cliques
and Speeded Up Robust Features
OVERVIEW
Footwear impression researcherssought to increase the accuracy and reliability of impression image matching. They developed and tested a statistical algorithm to quantify and score the degree of similarity between a questioned outsole impression and a reference impression obtained from either a suspect or a known database. The resulting algorithm proved to work well, even with partial and partial-quality images.
Lead Researchers
Soyoung Park Alicia Carriquiry
Journal
Statistical Analysis and Data Mining
Publication Date
21 Feb. 2020
Publication Number
IN 104 FW
The Goals
1
Develop a semi-automated approach that:
Compares impression evidence imagery with putative suspect or database images.
Calculates a score to quantify the degree of similarity (or correspondence) between the images.
Lowers human error and bias in current practice.
2
Create a method to obtain a similarity score for a pair of impressions which can be used to assess the probative value of the evidence.
APPROACH AND METHODOLOGY
This algorithm focuses on the similarity between two outsole images and relies on the concept of maximum clique. Local maximum cliques can be used to find corresponding positions in the two images so that they can be aligned.
Rotation and translation don’t affect a maximum clique –– it depends on the pairwise distances between nodes on the graph.
So –– although outsole pattern images may be translated, rotated and subjected to noise and other loss of information –– the geometrical relationships between the points that constitute the pattern will not change much.
Study of graphs made up of vertices connected by edges
Clique
A subset of vertices with edges linking symmetrically, where every two disinct vertices are adjacent
Maximum Clique
Clique that includes the larges possible number of vertices
KEY TAKEAWAYS FOR PRACTITIONERS
1
With this new comparison learning algorithm, practitioners can align images using features chosen as areas of interest and calculate a similarity score more objectively.
2
The proposed pattern-matching algorithm can work with partial images or images of variable quality by partially aligning patterns to quantify degrees of similarity between two impressions.
3
While this study focuses on footwear evidence, this algorithm has potential applications for other situations of pattern comparison, like:
latent prints
surveillance photos
handwriting
tire treads and more.
4
The algorithm can distinguish impressions made by different shoes –– even when shoes share class characteristics including degree of wear.
SEE THE ALGORITHM IN ACTION
Researcher Dr. Soyoung Park demonstrates the team’s novel algorithm in a CSAFE webinar. The method is promising, because it appears to correctly determine, with high probability, whether two images have a common or a different source, at least for the shoes on which they have experimented.
A Robust Approach to
Automatically Locating Grooves
in 3D Bullet Land Scans
OVERVIEW
Land engraved areas (LEAs) can be important distinguishing factors when analyzing 3D scans from bullets. Creating a 3D image of an LEA requires examiners to also scan portions of the neighboring groove engraved areas (GEAs). Current modeling techniques often struggle to separate LEAs from GEAs. CSAFE researchers developed a new method to automatically remove GEA data and tested this method’s performance against previously proposed techniques.
Lead Researchers
Kiegan Rice Ulrike Genschel Heike Hofmann
Journal
Journal of Forensic Sciences
Publication Date
13 December 2019
Publication Number
IN 103 FT
GOAL
1
Present and discuss automated methods for identifying “shoulder locations” between LEAs and GEAs.
The Study
Rice et al. gathered 3D scans of 104 bullets from two available data sets (Hamby 44 and Houston), resulting in a total of 622 LEA scans.
They removed the curvature from these 3D scans to make 2D crosscuts of each LEA.
Using the 2D crosscuts, the team estimated the shoulder locations between LEAs and GEAs using three different models:
Rollapply:
A function (in this case, one available through the open-source “bulletxtrctr” package) which applies a rolling average to smooth out outliers in data.
Robust Linear Model:
A quadratic linear model that minimizes absolute deviations and is therefore less influenced by outliers.
Robust Locally Weighted Regression (LOESS):
A weighted average of many parametric models to fit subsets of data.
Results
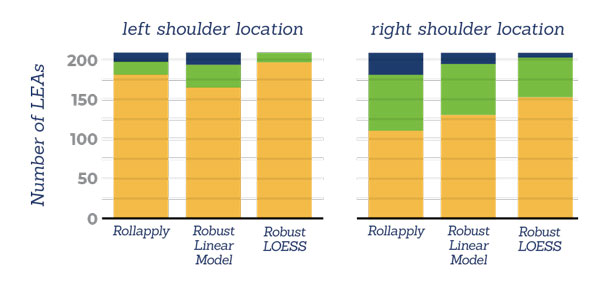
Hamby set 44
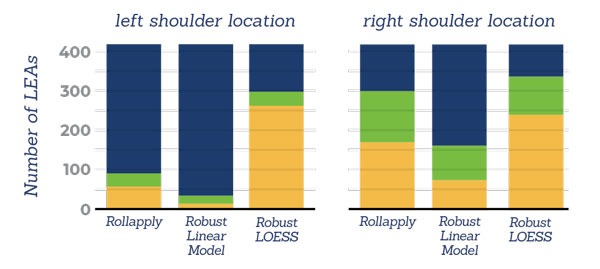
Houston test set
areas of misidentification:
In this graphic, an Area of Misidentification less than 100 is considered a small deviation, between 100 and 1000 is medium, and greater than 1000 is a large deviation.
The Robust LOESS model significantly outperformed the Rollapply and Robust Linear models, resulting primarily in small deviations across all test sets.
Conversely, the Robust Linear model had the weakest performance of all three, with mostly large deviations across both Houston sets, and only outperforming the Rollapply model in the right shoulder section of the Hamby 44 set.
These results were expected, as the Robust LOESS model is intended to be flexible and handle areas that a quadratic linear model would fail to address.
FOCUS ON THE FUTURE
Both the Hamby 44 and Houston datasets used firearms from the same manufacturer. Future studies can expand on these findings by using a wider variety of barrel types, including different caliber sizes, manufacturers and nontraditional rifling techniques.
Quantifying the Association
Between Discrete Event Time
Series with Applications
to Digital Forensics
Effects of Proficiency and Cross-examination
OVERVIEW
Digital devices provide a new opportunity to examiners because for every user event — like opening software, browsing online, or sending an email — an event time series is created, logging that data. Yet, using this type of user-generated event data can be difficult to correlate between two devices for examiners. The research team set out to quantify the degree of association between two event time series both with and without population data.
Lead Researchers
Christopher Galbraith Padhraic Smyth Hal S. Stern
Journal
Journal of the Royal Statistical Society
Publication Date
January 2020
Publication Number
IN 102 DIG
The Goals
1
Investigate suitable measures to quantify the association between two event series on digital devices.
2
Determine the likelihood that the series were generated by the same source or by different sources –– ultimately to assess the degree of association between the two event series.
APPROACH AND METHODOLOGY
Researchers explored a variety of measures for quantifying the association between two discrete event time series. They used multiple score functions to determine the similarity between the series. These score functions were discriminative for same- and different-source pairs of event series.
The following methods for assessing the strength of association for a given pair of event series proved most accurate:
1
Constructing score-based likelihood ratios (SLRs) that assess the relative likelihood of observing a given degree of association when the series came from the same or different sources. This uses a population-based approach.
2
Calculating coincidental match probabilities (CMPs) to simulate a different-source score distribution via what the research team refers to as sessionized resampling when working with a single pair of event series. When a sample from a relevant population is not available, this method still produces accurate results.
KEY TAKEAWAYS for Practitioners
1
The population-based approach of SLRs remains the preferred technique in terms of accuracy and interpretability.
2
The resampling technique using CMPs shows significant potential for quantifying the association between a pair of time event series, helping examiners determine the likelihood that two different time series were created by the same person, especially when no population sampling data is available.
3
With multiple-event series, combining these techniques could be valuable for pattern mining to determine which event series are associated with one another.
4
Developments in this area have the capacity to positively impact work in forensic and cybersecurity settings.
Next Steps
Both SLR and CMP techniques require more extensive study and testing before being used in practice by forensic examiners.
What do Forensic Analysts
Consider Relevant to
their Decision Making?
OVERVIEW
Forensic analysts make critical judgments that can play a crucial role in criminal investigations, so it is important that their decisions are as objective as possible. However, they often receive information that may not be relevant to their work and can subconsciously bias their analyses. Researchers surveyed analysts from multiple forensic disciplines to see what information they consider relevant to their tasks.
Lead Researchers
Brett O. Gardner Sharon Kelley Daniel C. Murrie Itiel E. Dror
Journal
Science and Justice
Publication Date
September 2019
Publication Number
IN 101 IMPL
Goals
1
Discover what information analysts consider relevant
2
Evaluate whether there is a general consensus across disciplines
3
Determine if these opinions match the National Commission of Forensic Science’s definition of task-relevance
The Study
The National Commission of Forensic Science (NCFS) defines task-relevant information as:
“Necessary for drawing conclusions: 1) about the propositions in question, 2) from the physical evidence that has been designated for examination, [and] 3) through the correct application of an accepted analytic method by a competent analyst.”
The team surveyed 183 forensic analysts among four primary forensic disciplines: Biology, Pattern Evidence, Chemistry, and Crime Scene Investigation. The survey contained 16 different types of information regarding either a case, suspect, or victim.
The analysts categorized the importance of each type of information to their specific tasks, labeling them as either:
Essential
Irrelevant
Would Review If Available
Results
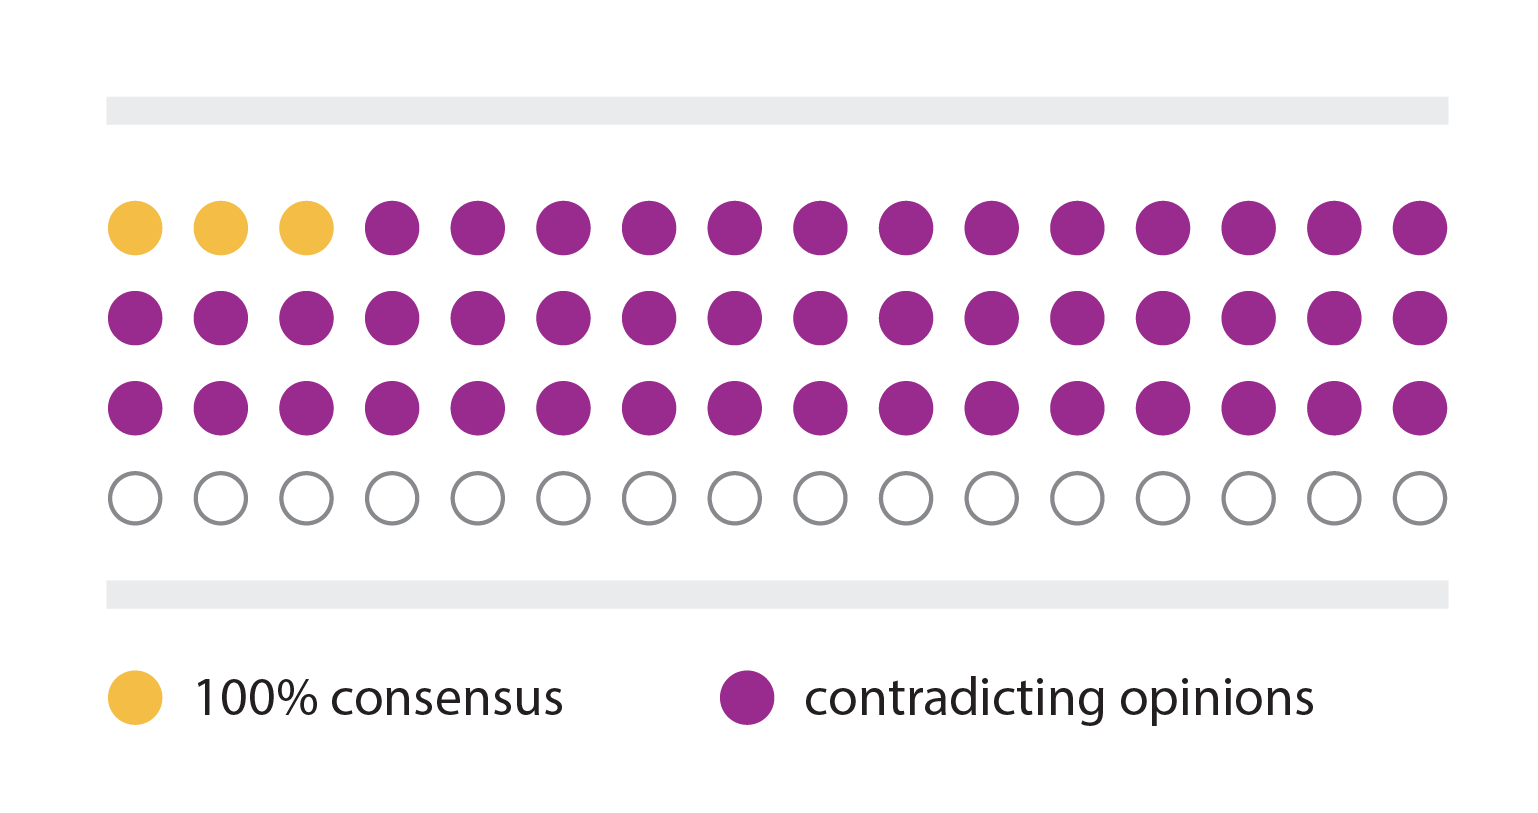
1
Among four forensic science disciplines and 16 types of information (resulting in 64 total ratings for task-relevance), the analysts only reached 100% consensus three times. In fact, in 45 of 64 items, opinions between analysts directly contradicted each other.
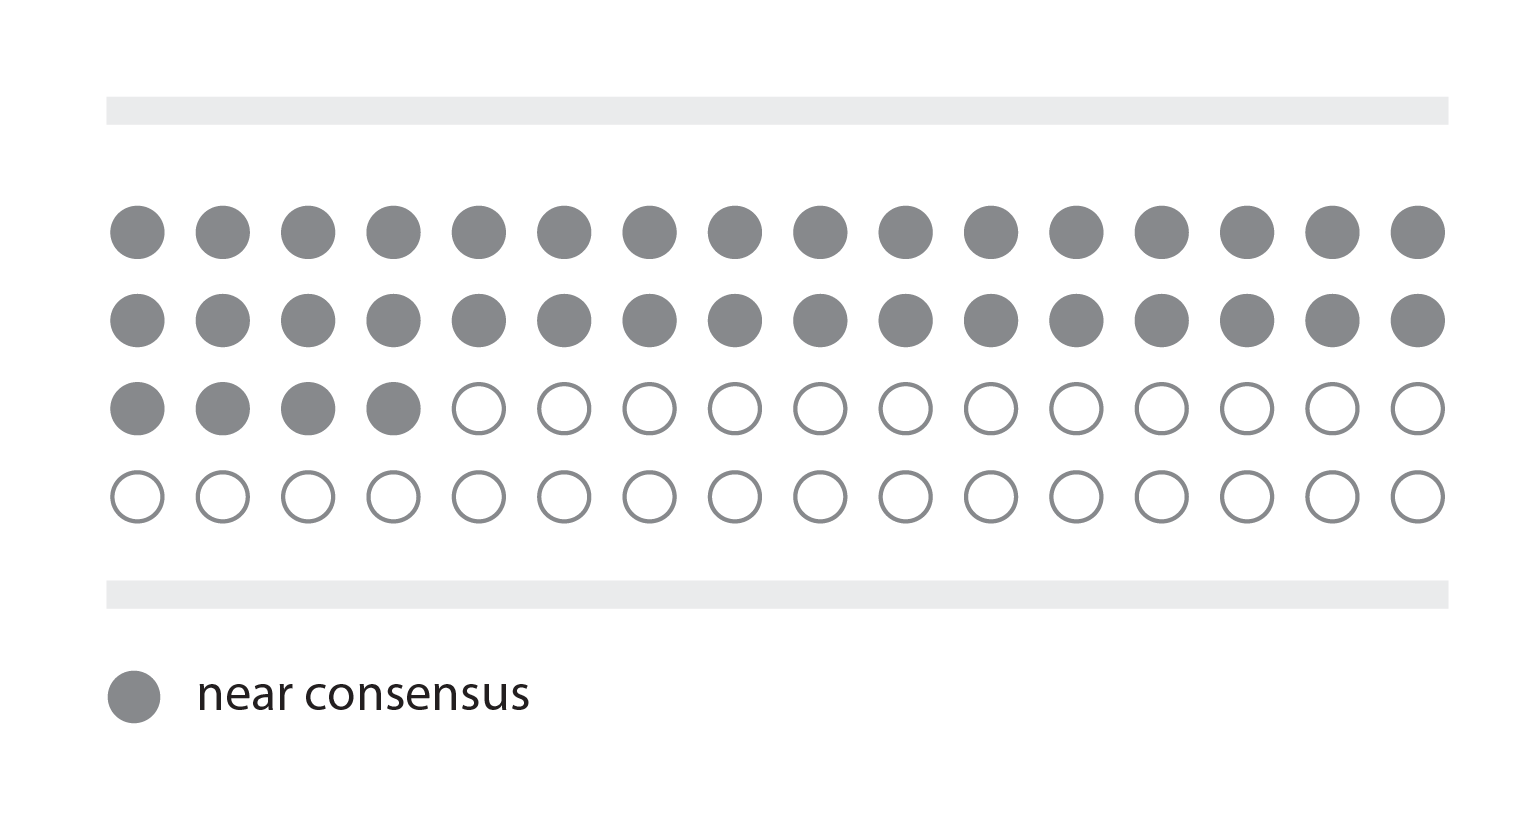
2
However, in 36 ratings, the analysts reached a near-consensus where over 75% agreed. Pattern evidence analysts had the highest rate of consensus and crime scene investigators had the most disagreement.
3
Most analysts, apart from crime scene investigators, agreed that personal information regarding a suspect or victim was irrelevant to their tasks. This is consistent with the NCFS’s guidelines for task relevance.
4
The opinions of crime scene investigators were distinct from the other disciplines, as their task is to gather information rather than analyze it.
Focus on the future
While the survey contains which types of information the analysts consider relevant, it does not explain why they made these decisions.
It is important to remember that people do not always know the full reasoning behind their decision making.
Even within the same forensic disciplines, different laboratories may not have the same guidelines for what they consider relevant.
The forensic disciplines must reach a general consensus on what information is task-relevant.