A Robust Approach to
Automatically Locating Grooves
in 3D Bullet Land Scans
OVERVIEW
Land engraved areas (LEAs) can be important distinguishing factors when analyzing 3D scans from bullets. Creating a 3D image of an LEA requires examiners to also scan portions of the neighboring groove engraved areas (GEAs). Current modeling techniques often struggle to separate LEAs from GEAs. CSAFE researchers developed a new method to automatically remove GEA data and tested this method’s performance against previously proposed techniques.
Lead Researchers
Kiegan Rice Ulrike Genschel Heike Hofmann
Journal
Journal of Forensic Sciences
Publication Date
13 December 2019
Publication Number
IN 103 FT
GOAL
1
Present and discuss automated methods for identifying “shoulder locations” between LEAs and GEAs.
The Study
Rice et al. gathered 3D scans of 104 bullets from two available data sets (Hamby 44 and Houston), resulting in a total of 622 LEA scans.
They removed the curvature from these 3D scans to make 2D crosscuts of each LEA.
Using the 2D crosscuts, the team estimated the shoulder locations between LEAs and GEAs using three different models:
Rollapply:
A function (in this case, one available through the open-source “bulletxtrctr” package) which applies a rolling average to smooth out outliers in data.
Robust Linear Model:
A quadratic linear model that minimizes absolute deviations and is therefore less influenced by outliers.
Robust Locally Weighted Regression (LOESS):
A weighted average of many parametric models to fit subsets of data.
Results
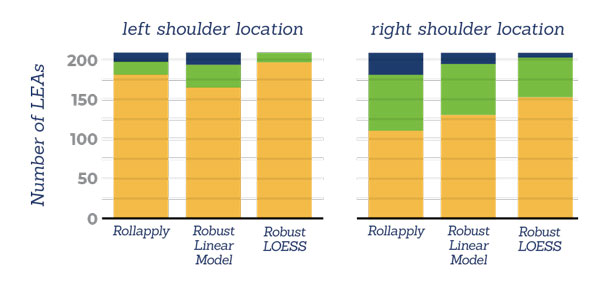
Hamby set 44
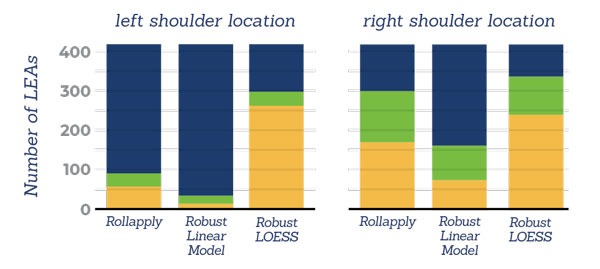
Houston test set
areas of misidentification:
In this graphic, an Area of Misidentification less than 100 is considered a small deviation, between 100 and 1000 is medium, and greater than 1000 is a large deviation.
The Robust LOESS model significantly outperformed the Rollapply and Robust Linear models, resulting primarily in small deviations across all test sets.
Conversely, the Robust Linear model had the weakest performance of all three, with mostly large deviations across both Houston sets, and only outperforming the Rollapply model in the right shoulder section of the Hamby 44 set.
These results were expected, as the Robust LOESS model is intended to be flexible and handle areas that a quadratic linear model would fail to address.
FOCUS ON THE FUTURE
Both the Hamby 44 and Houston datasets used firearms from the same manufacturer. Future studies can expand on these findings by using a wider variety of barrel types, including different caliber sizes, manufacturers and nontraditional rifling techniques.